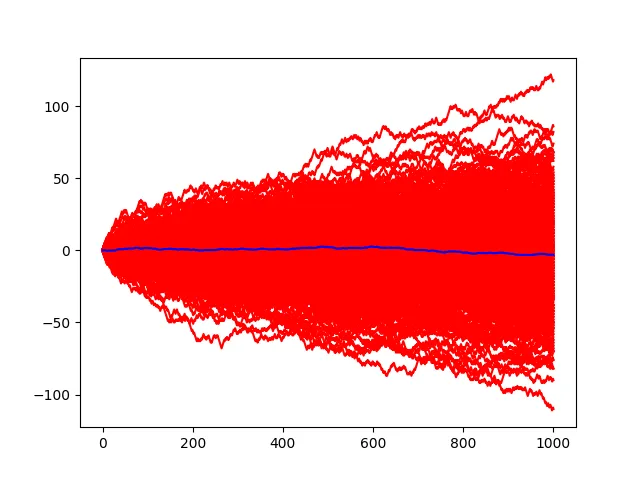
我被要求编写100个随机行走的代码,每个行走者有1000步。然后绘制这100名行走者平均步数的图表。我能够将所有行走者绘制在一个图表中,但无法找到绘制平均值的方法。任何帮助都将不胜感激。谢谢。
以下是我的代码:
import numpy as np
import matplotlib.pyplot as plt
import random

# 1
N = 100
for j in range(N):
    def randomwalk1D(n):
        x, t = 0, 0
        # Generate the time points [1, 2, 3, ... , n]
        time = np.arange(n + 1)
        position = [x]
        directions = [1, -1]
        for i in range(n):
            # Randomly select either +1 or -1
            step = np.random.choice(directions)

            # Move the object up or down
            if step == 1:
                x += 1
            elif step == -1:
                x -= 1
            # Keep track of the positions
            position.append(x)
        return time, position
    rw = randomwalk1D(1000)
    plt.plot(rw[0], rw[1], 'r-', label="rw")
plt.show()