我尝试使用poweRlaw包来绘制一些幂律拟合曲线。对于单条曲线似乎是起作用的。但我没法在同一图表上绘制多个曲线。 参考:这个包内有解决方法吗? [注:我是个新手]
set.seed(1)
x1 <- ceiling(rlnorm(1000, 4))
x2 <- ceiling(rlnorm(1000, 2))
library(poweRlaw)
pl_d = pl_data$new(x1)
plot(pl_d)
#Now fit the powerlaw
m = displ$new(pl_d)
#Estimate the cut-off
#estimate_xmin(m)
aaa <- estimate_xmin(m)
aaa <- as.data.frame(aaa)
aaa <- aaa[2,1]
x_min <- min(table(x))
m$setXmin(aaa); m$mle()
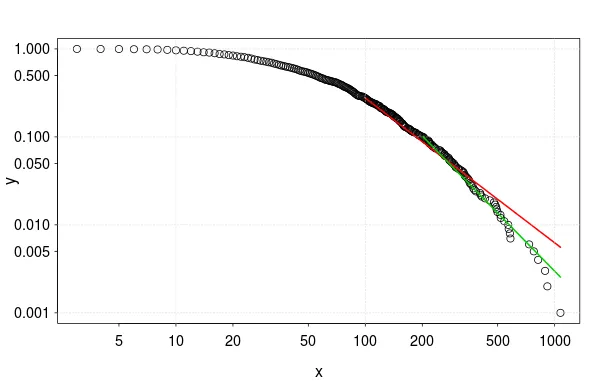
#Plot the data and the PL line
#plot(m)
lines(m, col=2)
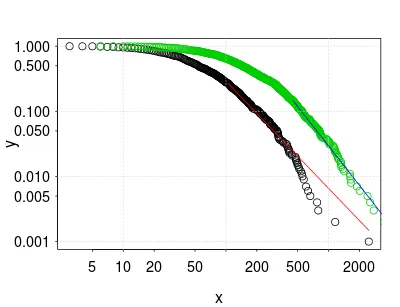
# next POWER LAW graph
#Plot the data
pl_d = pl_data$new(x2)
points(pl_d)
#Now fit the powerlaw
m = displ$new(pl_d)
#Estimate the cut-off
#estimate_xmin(m)
aaa <- estimate_xmin(m)
aaa <- as.data.frame(aaa)
aaa <- aaa[2,1]
x_min <- min(table(x))
m$setXmin(aaa); m$mle()
#Plot the data and the PL line
#points(m)
lines(m, col=3)