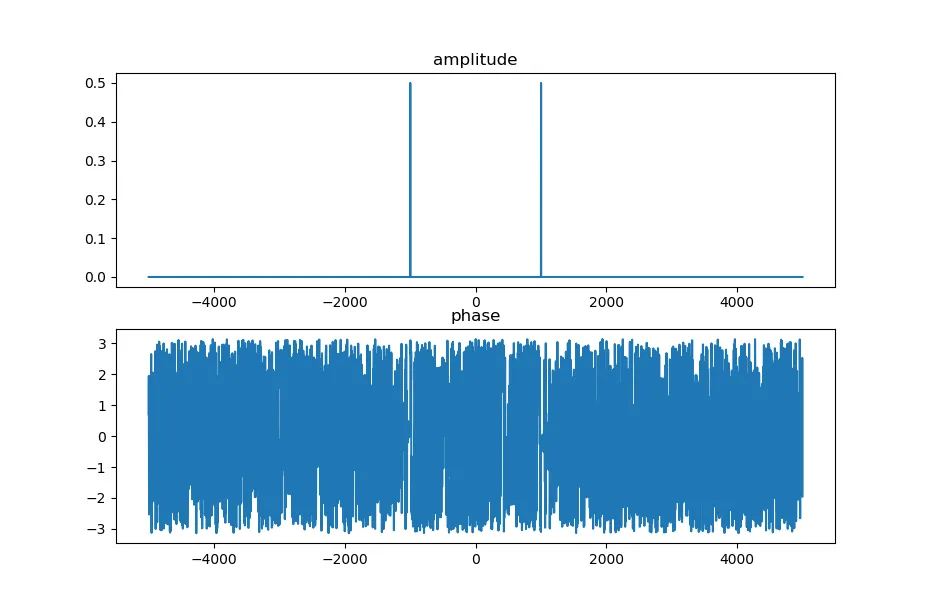
我比较了Matlab和numpy中的相位和幅度谱。我认为Matlab的工作是正确的,但是numpy计算出了正确的幅度谱,但相位谱很奇怪。我该如何更改Python代码以通过numpy进行正确的fft计算?
Matlab代码:
Python:
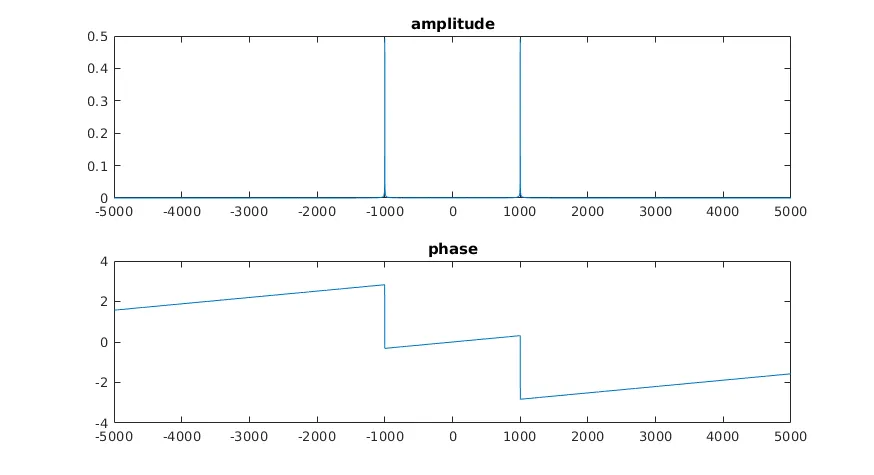
Matlab代码:
fs = 1e4;
dt = 1 / fs;
t = 0:dt:0.5;
F = 1e3;

y = cos(2*pi*F*t);
S = fftshift(fft(y) / length(y));
f_scale = linspace(-1, 1, length(y)) * (fs / 2);

a = abs(S);
phi = (angle(S));

subplot(2, 1, 1)
plot(f_scale, a)
title('amplitude')

subplot(2, 1, 2)
plot(f_scale, phi)
title('phase')
Python:
import numpy as np
import matplotlib.pyplot as plt

fs = 1e4
dt = 1 / fs
t = np.arange(0, 0.5, dt)
F = 1e3

y = np.cos(2*np.pi*F*t)
S = np.fft.fftshift(np.fft.fft(y) / y.shape[0])
f_scale = np.linspace(-1, 1, y.shape[0]) * (fs / 2)

a = np.abs(S)
phi = np.angle(S)

plt.subplot(2, 1, 1, title="amplitude")
plt.plot(f_scale, a)

plt.subplot(2, 1, 2, title="phase")
plt.plot(f_scale, phi)

plt.show()
fft_y = fft(y);abs_y=np.abs(fft_y);fft_y = np.where(abs_y<10,0,fft_y)。 - Joey Gao