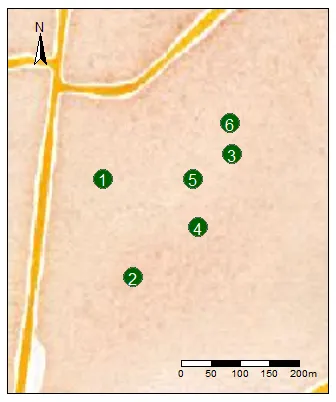
我正在尝试使用ggmap和Stamen地图制作我的研究区域地图。我看到了一些类似的问题,但还没有找到将解决方案合并到我的Stamen地图代码中的方法。
关于此,我有两个问题: 1.如何自定义地图上的点的标签? 2.如何向Stamen地图添加比例尺?(可以作为表示距离的线条或类似“地图上的x厘米=现实生活中的y公里”这样的方式)
Tcoords <- read.csv("Tcoords.csv")
我的文件看起来像这样
# trap latitude longitude
1 52.34431 0.5374620
2 52.34281 0.5382080
3 52.34468 0.5406787
4 52.34357 0.5398280
5 52.34431 0.5397050
6 52.34516 0.5406294
针对建议,我已经在这里粘贴了 dput(head(Tcoords)) 的结果:
 structure(list(trap = c("1", "2", "3", "4", "5", "6"), latitude = c(52.344312,
52.342809, 52.3446849, 52.343572, 52.34431, 52.3451601), longitude = c(0.537462,
0.538208, 0.5406787, 0.539828, 0.539705, 0.5406294)), row.names = c(NA,
6L), class = "data.frame")
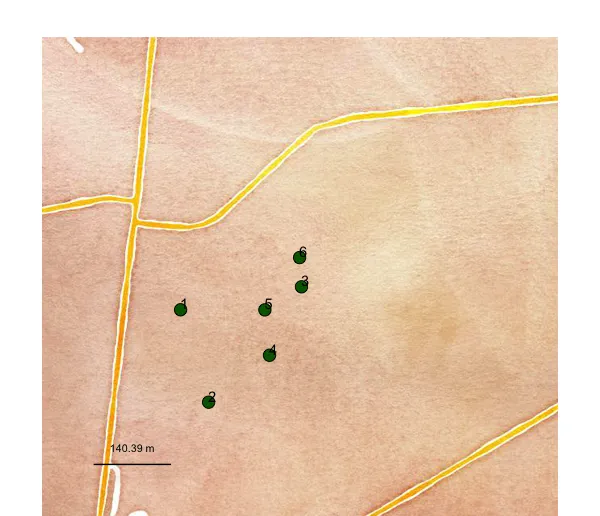
这是我用来绘制点的代码。
center = c(lon = 0.5406294, lat = 52.3451601)
qmap(center, zoom = 16, source = "stamen", maptype = "watercolor")+
      geom_point(aes(x = longitude, y = latitude), size = 4, shape = 21,
                 fill = "dark green", data = Tcoords)
但是一些方式 trap 没有被识别为一个对象。这可能是一些基础问题,但由于我是 R 的新手,我不太确定自己漏掉了什么。我已经将“trap”保存在此处作为文本对象。
感谢您的帮助!