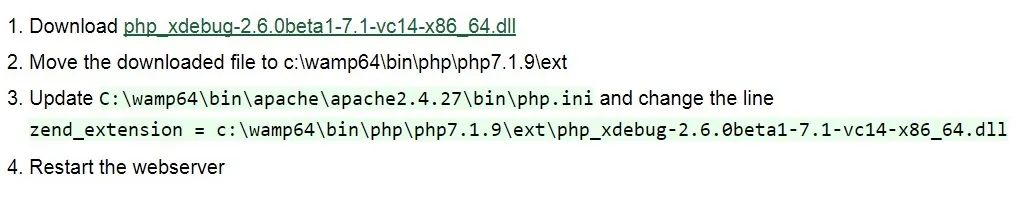
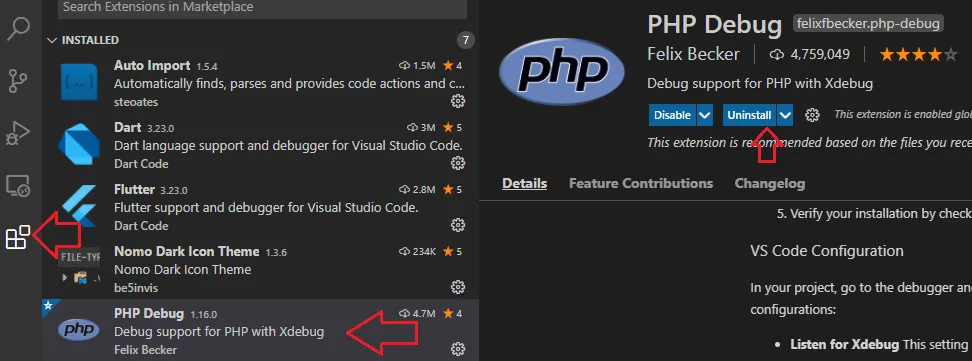
我已经安装了VS Code和PHP调试器。
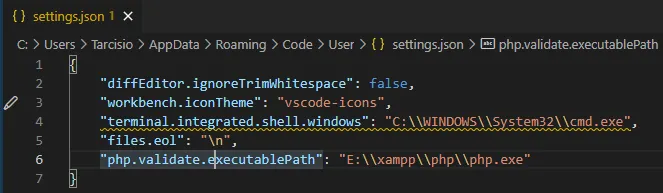
我正在使用xampp。
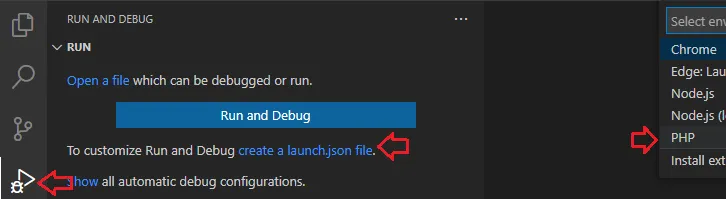
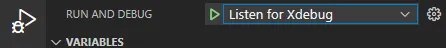
我尝试以两种方式运行代码(侦听和启动)。
侦听仅仅坐在那里,而启动在调试控制台中显示 spawn php ENOENT。
这是我的launch.json文件。
    {
    "version": "0.2.0",
    "configurations": [

        {
            "name": "Listen for XDebug",
            "type": "php",
            "request": "launch",
            "port": 9000
        },
        {
            "name": "Launch currently open script",
            "type": "php",
            "request": "launch",
            "program": "${file}",
            "cwd": "${fileDirname}",
            "port": 9000
        }
    ]
}
我做错了什么?