我想制作一个条件气泡图,根据簇绘制,每个气泡的大小由第三个“percent”变量设置。根据ggplot2文档,我认为我应该能够通过scale_size_area实现这一点。我不清楚为什么这不起作用,当percent=0时我仍然看到非常小的点。(如果我误解了,我也希望能得到解决方案。在我的真实数据中,区分0和非常接近0非常重要。)
ex <- data.frame(Condition=rep(c("ex1","ex2","ex3","ex4"),4),
                 Cluster=c(rep(1,4),rep(2,4),rep(3,4),rep(4,4)),
             Percent=c(0,0,0,1,0.25,0,0.25,0.5,1,0,0,0,0.25,0.25,0.25,0.25))
ggplot(ex, aes(Cluster, Condition, size=Percent))+
           geom_point(color = "blue")+ scale_size_area(max_size=20)
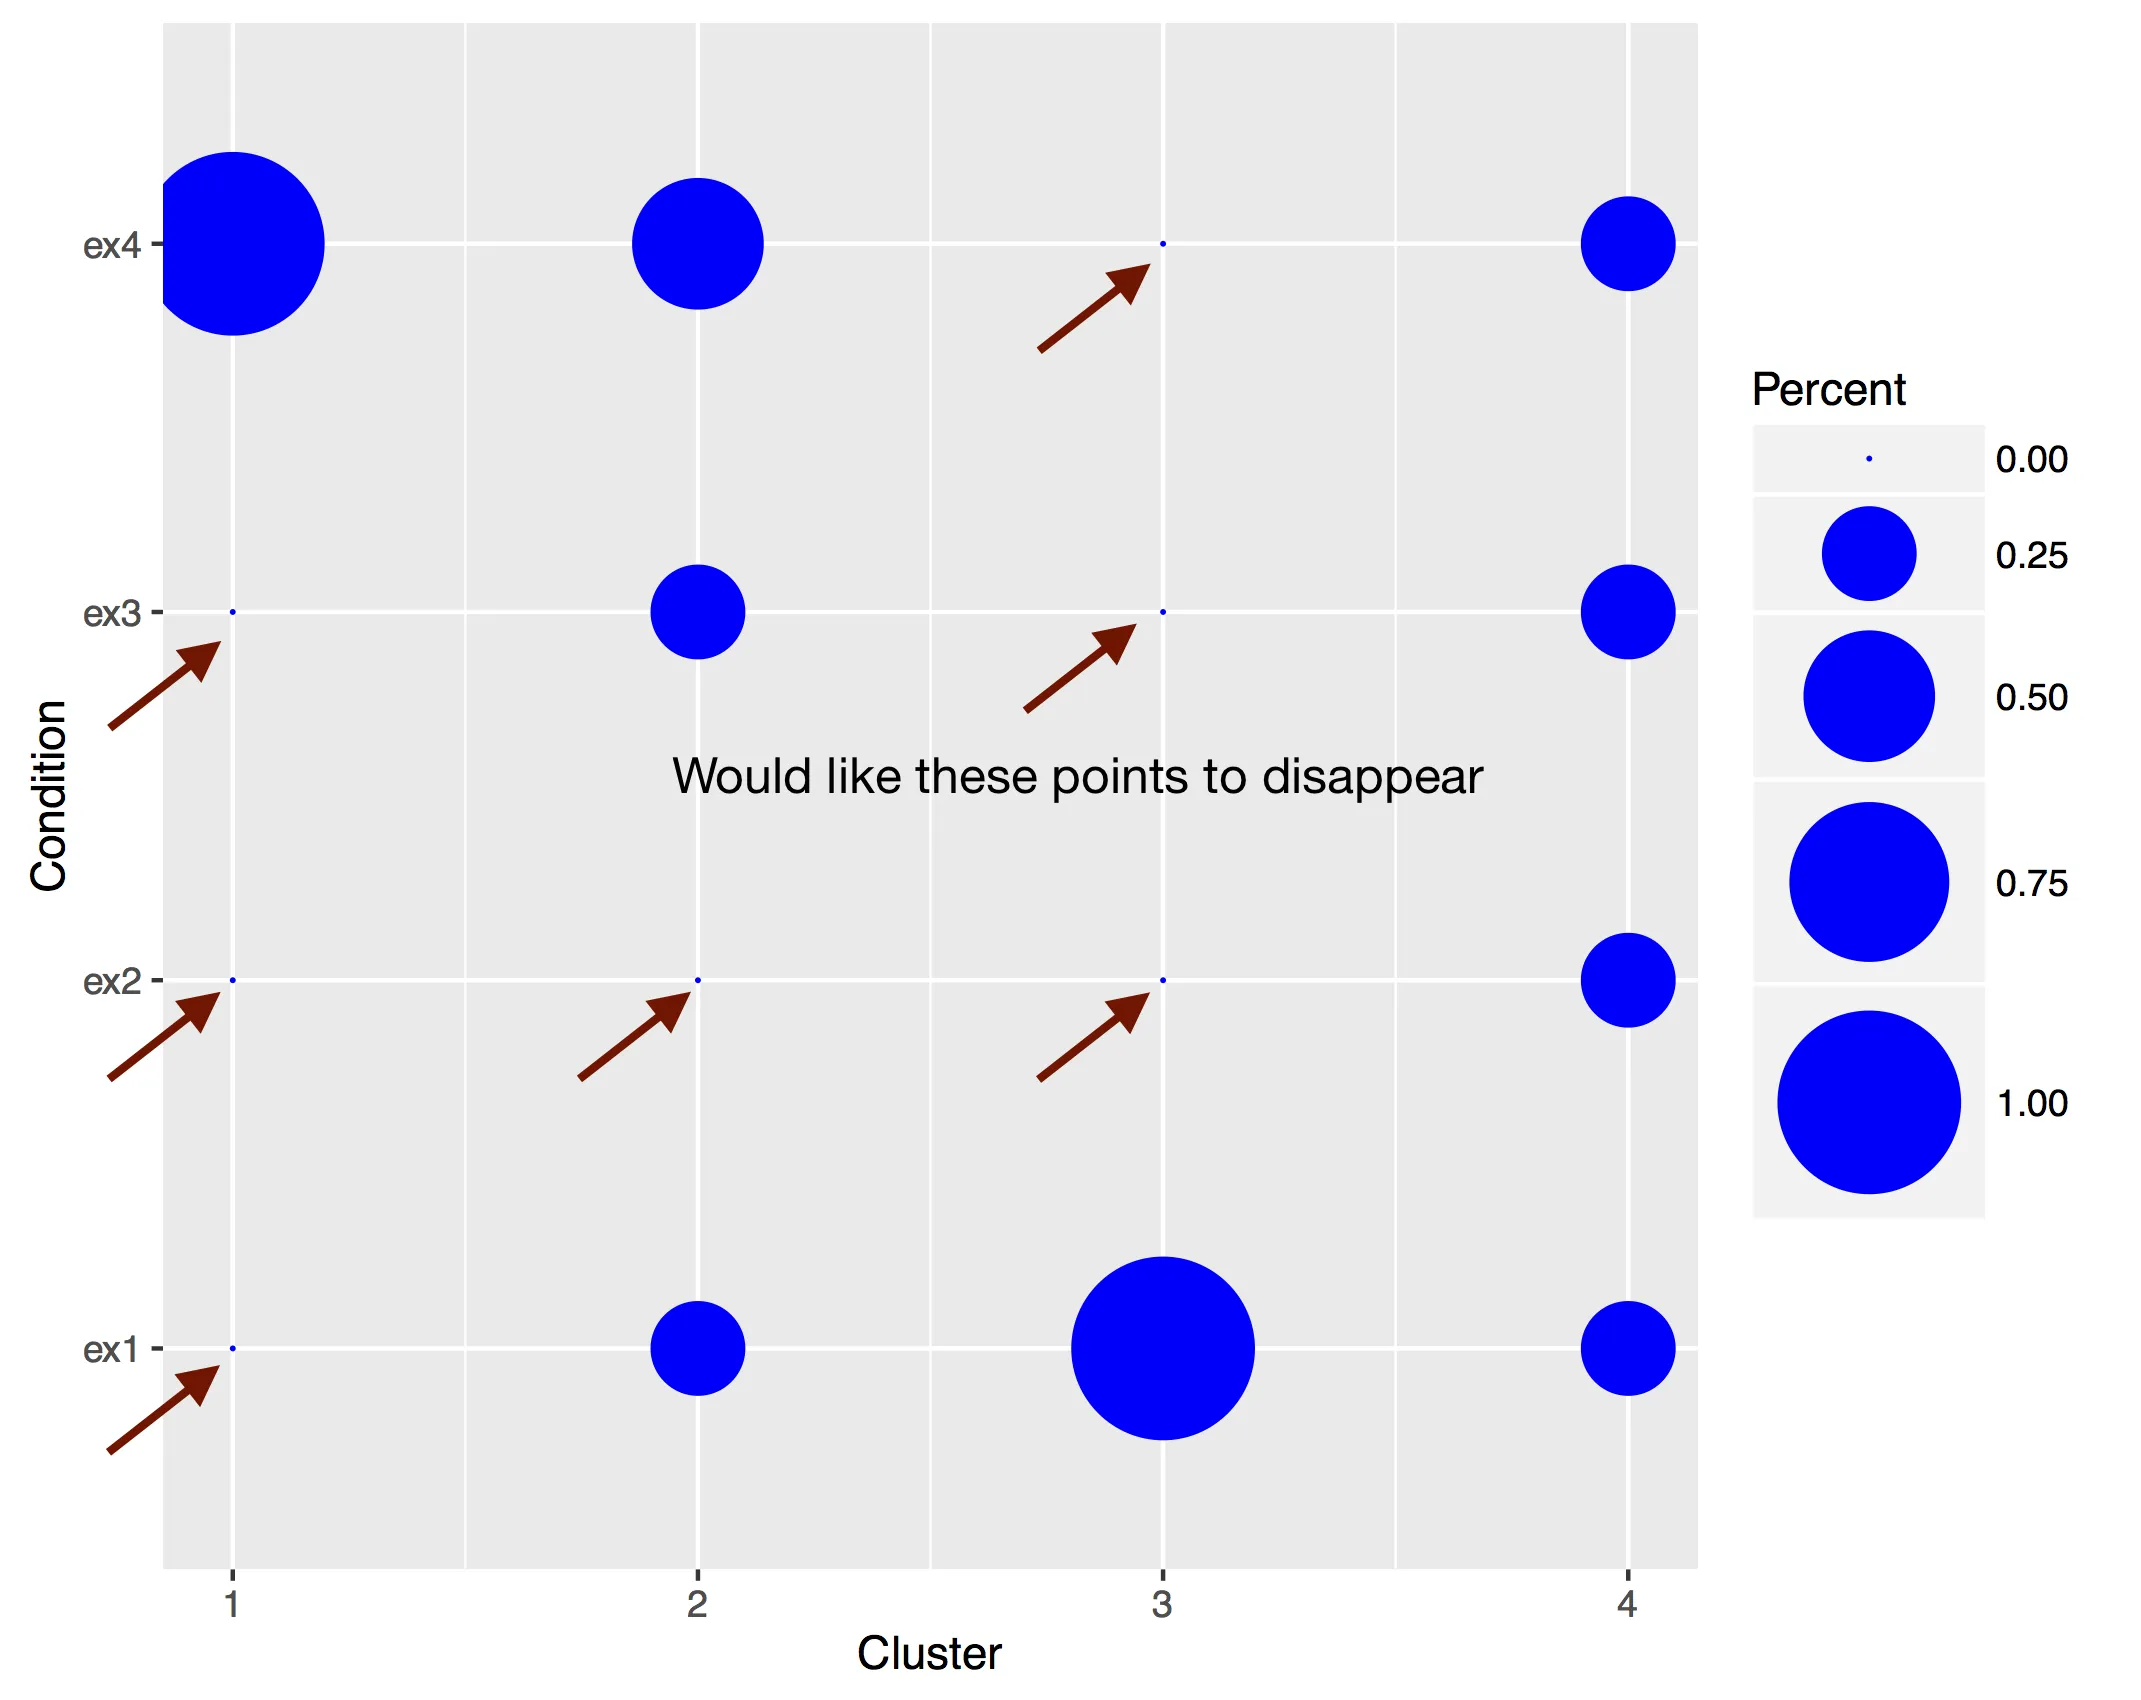
ifelse(Percent==0, NA, Percent)代替size=Percent? - lukeAgeom_point中使用stroke = 0会在Percent为0时删除这些点。 - aosmith