我有两个时间序列的数据,我想将它们绘制在一起。x轴将是日期,y轴将是系列1的折线图,而点的大小将根据系列2的数值进行缩放。但是,当系列2 = 0时,我希望ggplot不显示任何点。我尝试设置点大小的范围为最小值为0,但仍会显示值为0的点。
以下是重现问题的代码:
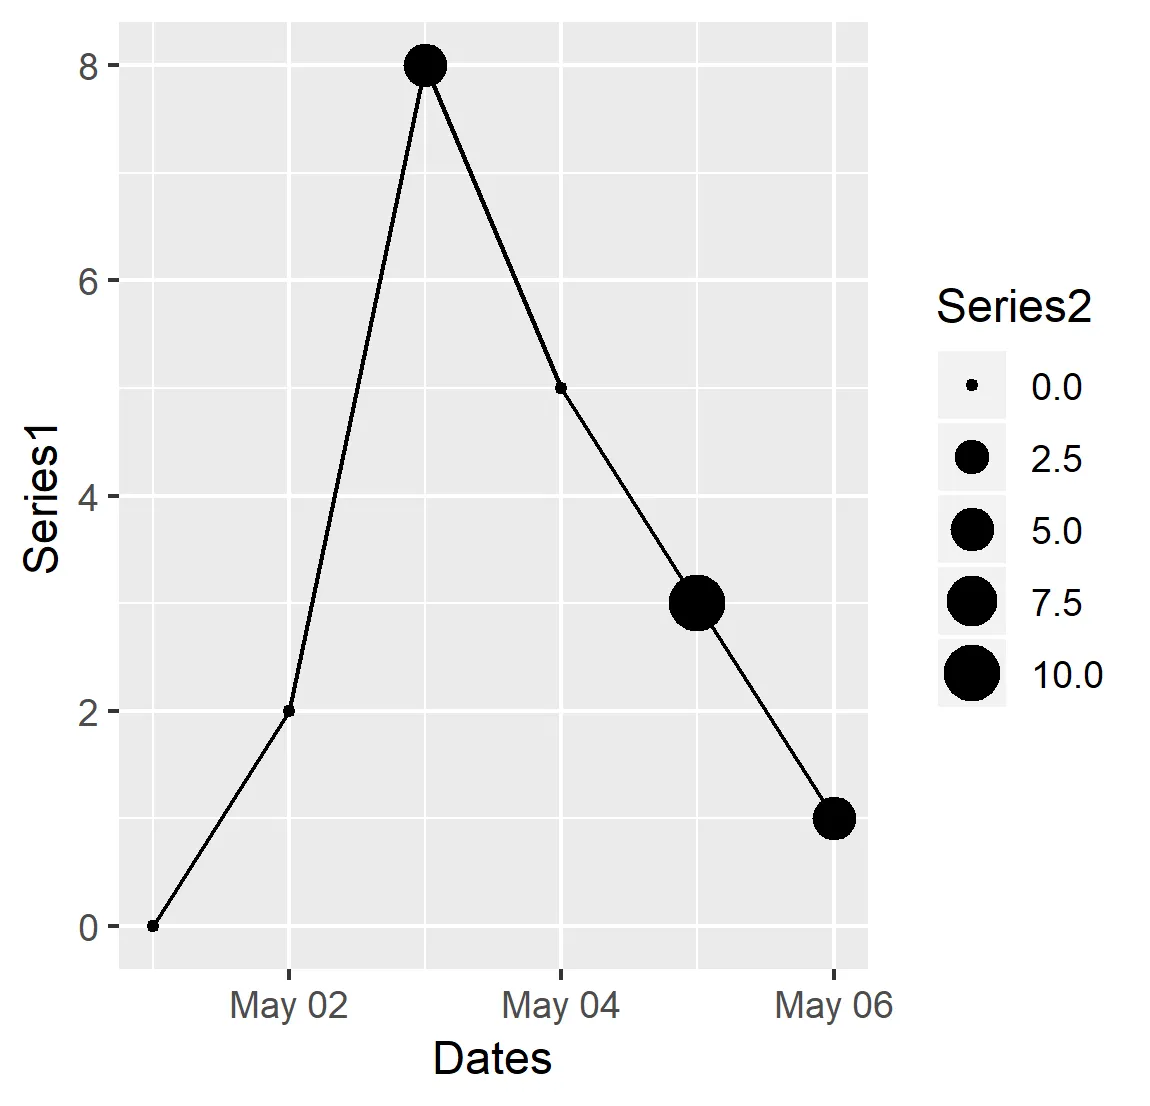
Dates = c("2015-05-01", "2015-05-02", "2015-05-03", "2015-05-04", "2015-05-05", "2015-05-06")
Dates = as.Date(Dates)
Series1 = c(0,2,8,5,3,1)
Series2 = c(0,0,5,0,10,5)

df = data.frame(Dates, Series1, Series2)
ggplot(data = df)+
   geom_line(aes(x=Dates, y = Series1))+
   geom_point(aes(x=Dates, y = Series1, size = Series2))+
   scale_size_continuous(range = c(0, 5))
这将产生以下图形:
 如何使ggplot2在Series2 = 0时不创建点,但仍显示线条?
我还尝试用NA替换Series2中的0,但这会导致绘图失败。
如何使ggplot2在Series2 = 0时不创建点,但仍显示线条?
我还尝试用NA替换Series2中的0,但这会导致绘图失败。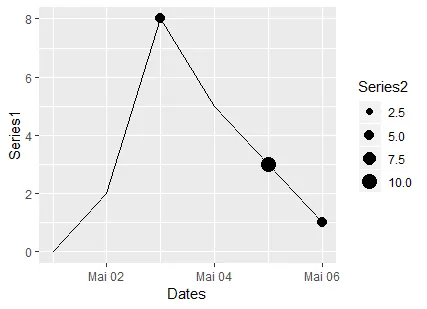
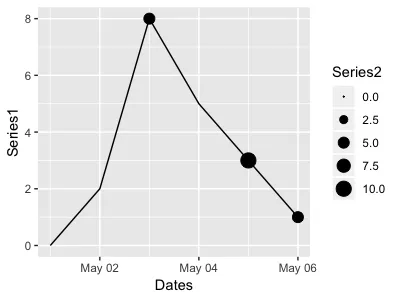
scale_size_area只需要一个最大值,以便将0值放置在大小为0的位置。 - camille