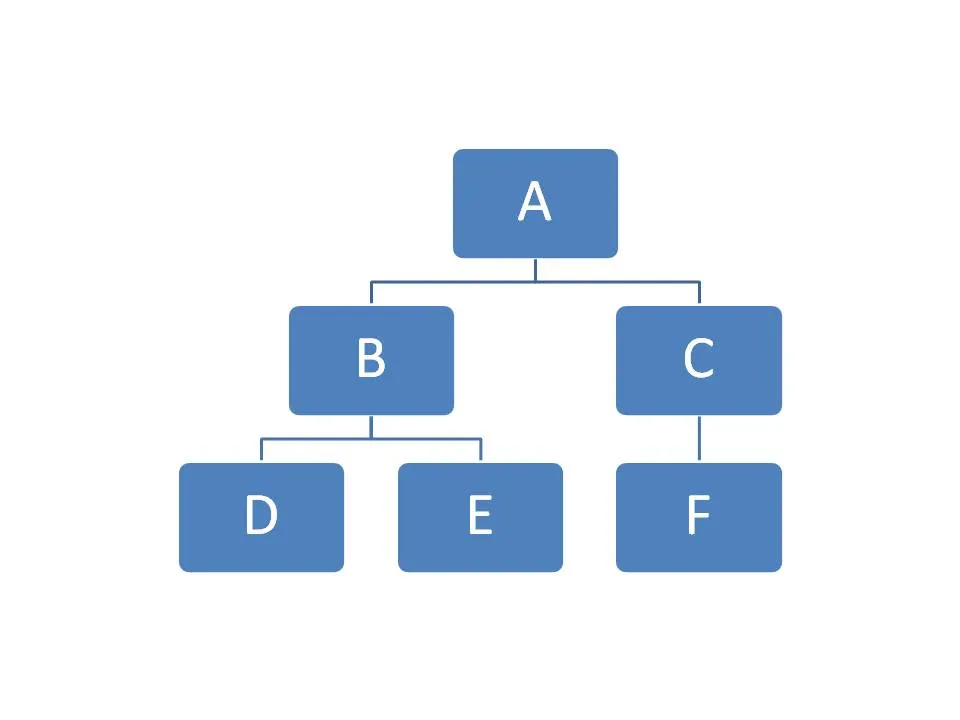
我想知道如何在Android中实现组织结构图?以下是我的布局示意图:
我知道@Tasos已经回答了这个问题。
但是这是一个我创建的子类,以帮助简化使用。
创建一个OrganizationChart.java
import android.app.Activity;
import android.util.Log;

public class OrganizationChart {
    private Activity activity;
    private static OrganizationChart instance;
    public String htmlCode = "";
    private OrganizationChart(Activity activity) {
        this.activity = activity;
    }
    public static OrganizationChart getInstance(Activity activity) {
        if (instance == null) {
            instance = new OrganizationChart(activity);

        }
        return instance;
    }
    public void addChildToParent(String Child,String Parent){
        htmlCode += "['"+Child+"', '"+Parent+"', ''],";
    }
    public void addChildToParent(String Child,String ChildFunction,String Parent){
        htmlCode += "[{'v':'"+Child+"', 'f':'Child"+ChildFunction+"'}, '"+Parent+"', ''],";
    }
    public void clearData(String Parent,String Child){
        htmlCode = "";
    }
    public String getChart(){
        Log.d("OrganizationChart","HTML: "+ htmlCode);
        Log.d("OrganizationChart","HTML1: "+ removeLastChar(htmlCode));
        return getTopCode() + removeLastChar(htmlCode) +getBottomCode();
    }
    private String getTopCode(){
        String topCode = "";
        topCode += "<html>";
        topCode += "<head>";
        topCode += "<script type=\"text/javascript\" src=\"https://www.gstatic.com/charts/loader.js\"></script>";
        topCode += "<script type=\"text/javascript\">";
        topCode += "google.charts.load('current', {packages:[\"orgchart\"]});";
        topCode += "google.charts.setOnLoadCallback(drawChart);";
        topCode += "function drawChart() {";
        topCode += "var data = new google.visualization.DataTable();";
        topCode += "data.addColumn('string', 'Name');";
        topCode += "data.addColumn('string', 'Manager');";
        topCode += "data.addColumn('string', 'ToolTip');";
        topCode += "data.addRows([";
        return topCode;
    }
    private String getBottomCode(){
        String bottomCode = "";
        bottomCode += "]);";
        bottomCode += "var chart = new google.visualization.OrgChart(document.getElementById('chart_div'));";
        bottomCode += " chart.draw(data, {'allowHtml':true});";
        bottomCode += " }";
        bottomCode += " </script>";
        bottomCode += "</head>";
        bottomCode += "<body>";
        bottomCode += "<div id=\"chart_div\"></div>";
        bottomCode += " </html>";
        return bottomCode;
    }
    private  String removeLastChar(String str) {
        return removeLastChars(str, 1);
    }
    private String removeLastChars(String str, int chars) {
        return str.substring(0, str.length() - chars);
    }

}
然后在需要使用时,可以像这样调用:
addChildToParent("child","parent");
OrganizationChart organizationChart = OrganizationChart.getInstance(this);
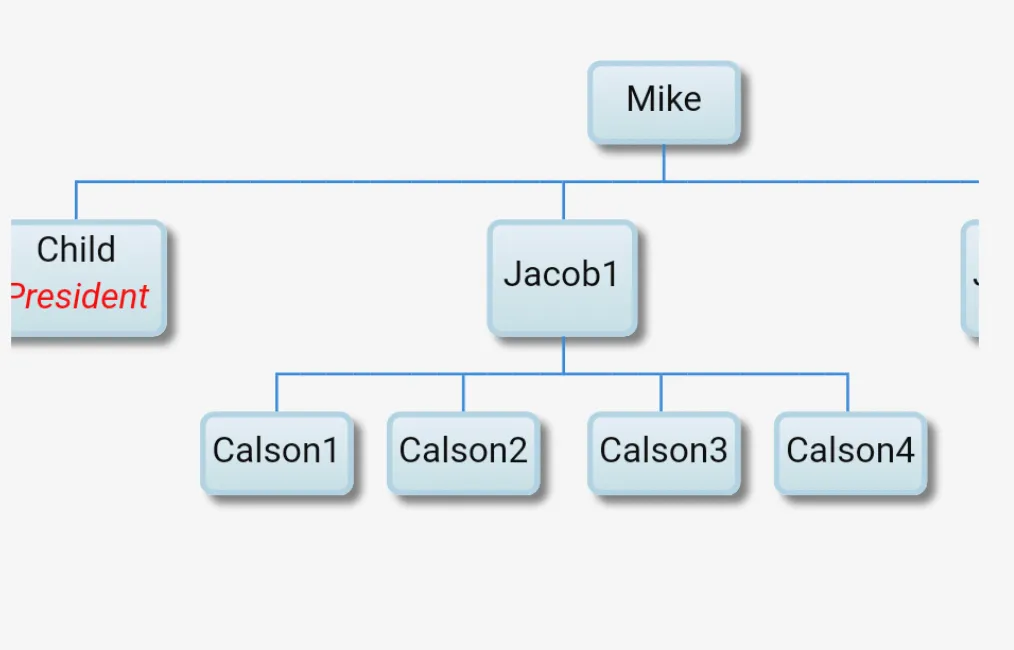
organizationChart.addChildToParent("Jacob","<div style=\\\"color:red; font-style:italic\\\">President</div>","Mike");
organizationChart.addChildToParent("Jacob1","Mike");
organizationChart.addChildToParent("Jacob2","Mike");
organizationChart.addChildToParent("Jacob3","Mike");
organizationChart.addChildToParent("Calson1","Jacob1");
organizationChart.addChildToParent("Calson2","Jacob1");
organizationChart.addChildToParent("Calson3","Jacob1");
organizationChart.addChildToParent("Calson4","Jacob1");
webView.getSettings().setJavaScriptEnabled(true);
webView.loadData(organizationChart.getChart(), "text/html", "UTF-8");
输出
https://developers.google.com/chart/interactive/docs/gallery/orgchart?hl=en
演示
从上面的链接中,点击 以查看其实际效果
代码
<html>
  <head>
    <script type="text/javascript" src="https://www.gstatic.com/charts/loader.js"></script>
    <script type="text/javascript">
      google.charts.load('current', {packages:["orgchart"]});
      google.charts.setOnLoadCallback(drawChart);

      function drawChart() {
        var data = new google.visualization.DataTable();
        data.addColumn('string', 'Name');
        data.addColumn('string', 'Manager');
        data.addColumn('string', 'ToolTip');

        // For each orgchart box, provide the name, manager, and tooltip to show.
        data.addRows([
          [{v:'Mike', f:'Mike<div style="color:red; font-style:italic">President</div>'},
           '', 'The President'],
          [{v:'Jim', f:'Jim<div style="color:red; font-style:italic">Vice President</div>'},
           'Mike', 'VP'],
          ['Alice', 'Mike', ''],
          ['Bob', 'Jim', 'Bob Sponge'],
          ['Carol', 'Bob', '']
        ]);

        // Create the chart.
        var chart = new google.visualization.OrgChart(document.getElementById('chart_div'));
        // Draw the chart, setting the allowHtml option to true for the tooltips.
        chart.draw(data, {allowHtml:true});
      }
   </script>
    </head>
  <body>
    <div id="chart_div"></div>
  </body>
</html>