目前,在ipython笔记本中创建两个连续的绘图时,它们会一个接一个地显示:
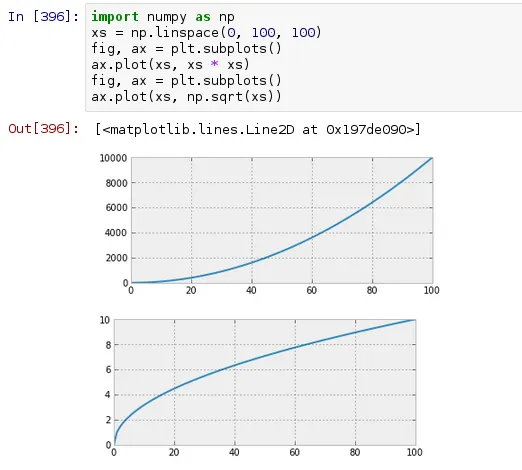
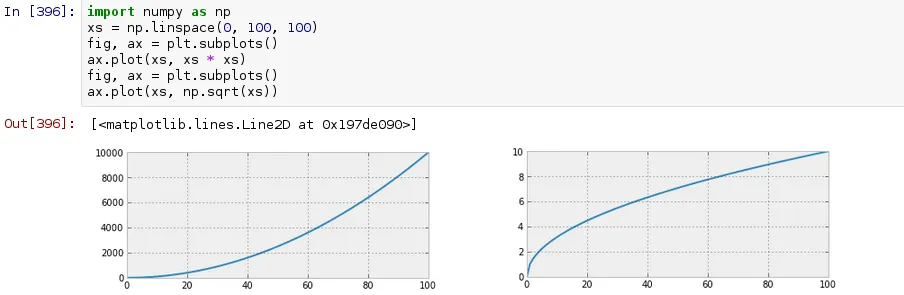
我想知道是否有任何方法可以将它们显示在行中,直到窗口的空间用尽为止。因此,对于前两个绘图,输出将如下所示:
我意识到我可以通过在网格中排列子图来做类似的事情,但我想知道是否可能自动完成,以便在空间用尽时将绘图包装到下一行中?
目前,在ipython笔记本中创建两个连续的绘图时,它们会一个接一个地显示:
我想知道是否有任何方法可以将它们显示在行中,直到窗口的空间用尽为止。因此,对于前两个绘图,输出将如下所示:
我意识到我可以通过在网格中排列子图来做类似的事情,但我想知道是否可能自动完成,以便在空间用尽时将绘图包装到下一行中?
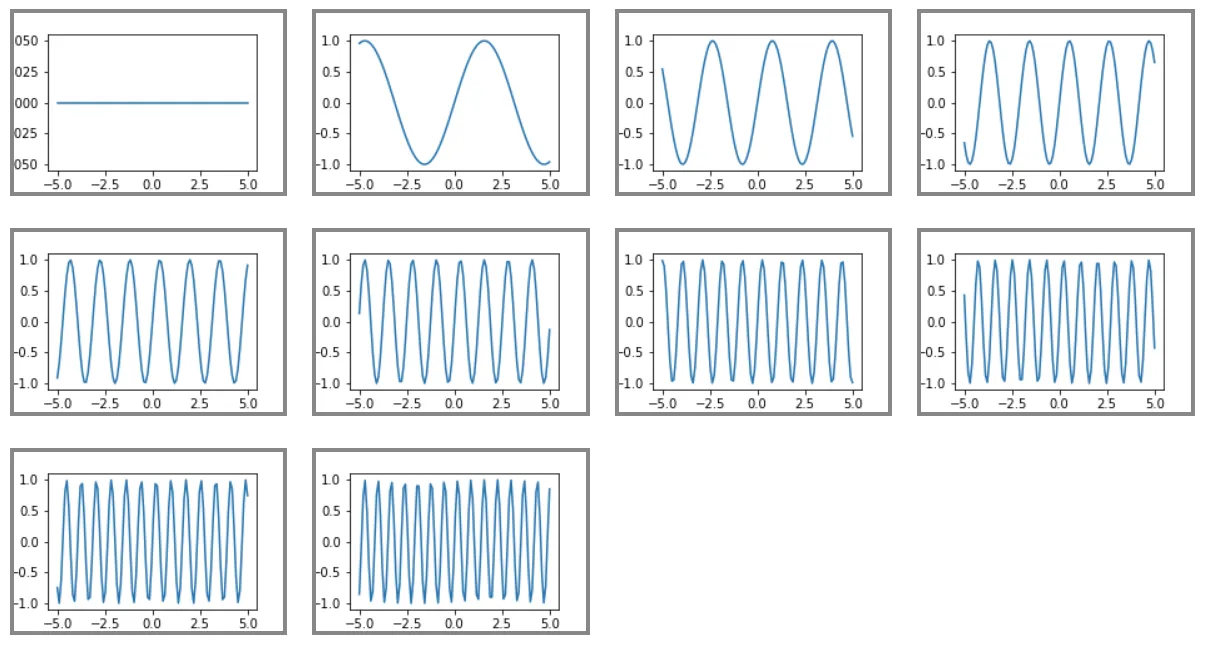
这在Python 3.5和Jupyter 4.4.0中适用。
当你调整浏览器窗口大小以填充水平空间时,图表会"随之流动"。
图表也可以是不同的大小(尝试替换figsize=(3+i/3,2+i/4) - 查看下面的第二张图片)
(刚刚意识到这个问题有多久了; 我定期寻找同样的东西。我承认代码是从其他网页示例拼凑而来的,但现在我已经找不到参考资料了)
import matplotlib.pyplot as plt
import numpy as np
from IPython.display import HTML
import io
import base64


class FlowLayout(object):
    ''' A class / object to display plots in a horizontal / flow layout below a cell '''
    def __init__(self):
        # string buffer for the HTML: initially some CSS; images to be appended
        self.sHtml =  """
        <style>
        .floating-box {
        display: inline-block;
        margin: 10px;
        border: 3px solid #888888;
        }
        </style>
        """

    def add_plot(self, oAxes):
        ''' Saves a PNG representation of a Matplotlib Axes object '''
        Bio=io.BytesIO() # bytes buffer for the plot
        fig = oAxes.get_figure()
        fig.canvas.print_png(Bio) # make a png of the plot in the buffer

        # encode the bytes as string using base 64
        sB64Img = base64.b64encode(Bio.getvalue()).decode()
        self.sHtml+= (
            '<div class="floating-box">'+
            '<img src="data:image/png;base64,{}\n">'.format(sB64Img)+
            '</div>')

    def PassHtmlToCell(self):
        ''' Final step - display the accumulated HTML '''
        display(HTML(self.sHtml))


oPlot = FlowLayout() # create an empty FlowLayout

# Some fairly regular plotting from Matplotlib
gX = np.linspace(-5,5,100) # just used in the plot example
for i in range(10): # plot 10 charts
    fig, ax = plt.subplots(1, 1, figsize=(3,2)) # same size plots
                           # figsize=(3+i/3,2+i/4)) # different size plots
    ax.plot(gX, np.sin(gX*i)) # make your plot here
    oPlot.add_plot(ax) # pass it to the FlowLayout to save as an image
    plt.close() # this gets rid of the plot so it doesn't appear in the cell


oPlot.PassHtmlToCell()

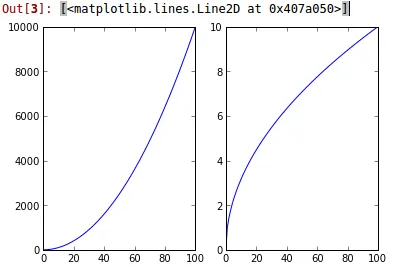
是的,您可以这样做:
In [3]: import numpy as np
   ...: xs = np.linspace(0,100,100)
   ...: fig, axs = plt.subplots(nrows=1, ncols=2)
   ...: axs[0].plot(xs, xs * xs)
   ...: axs[1].plot(xs, np.sqrt(xs))
   ...:
因为这个问题提出已经有一段时间了,所以我将为那些通过搜索引擎找到这个问题的人提供一个更新的解决方案。
由于Jupyter基本取代了IPython笔记本,而Jupyter Lab计划取代Jupyter,所以我的解决方案是在Jupyter Lab 0.35.4中实现的。
在这个环境中,我发现评估读取单元格的内容非常有用:
%%html

<style>
    .jp-OutputArea-child {
        display: inline-block;
    }
</style>
%%html

<style>
    .jp-OutputArea-child:has(> .jp-RenderedImage) {
        display: inline-block;
    }
</style>
ipywidgets:# Select ipywidget output for matplotlib
%matplotlib widget
import matplotlib.pyplot as plt
import ipywidgets
import numpy as np
xs = np.linspace(0, 100, 100)
# Capture each plot in an Output object instead of displaying outright
output1 = ipywidgets.Output()
with output1:
# Restrict the size, otherwise the full horizontal space will be taken
fig, axes = plt.subplots(constrained_layout=True, figsize=(4, 3))
fig.canvas.toolbar_position = 'bottom'
axes.plot(xs, xs * xs)
output2 = ipywidgets.Output()
with output2:
fig, axes = plt.subplots(constrained_layout=True, figsize=(4, 3))
fig.canvas.toolbar_position = 'bottom'
axes.plot(xs, np.sqrt(xs))
output3 = ipywidgets.Output()
with output3:
fig, axes = plt.subplots(constrained_layout=True, figsize=(4, 3))
fig.canvas.toolbar_position = 'bottom'
axes.plot(xs, xs)
HBox来将图形并排显示并换行:
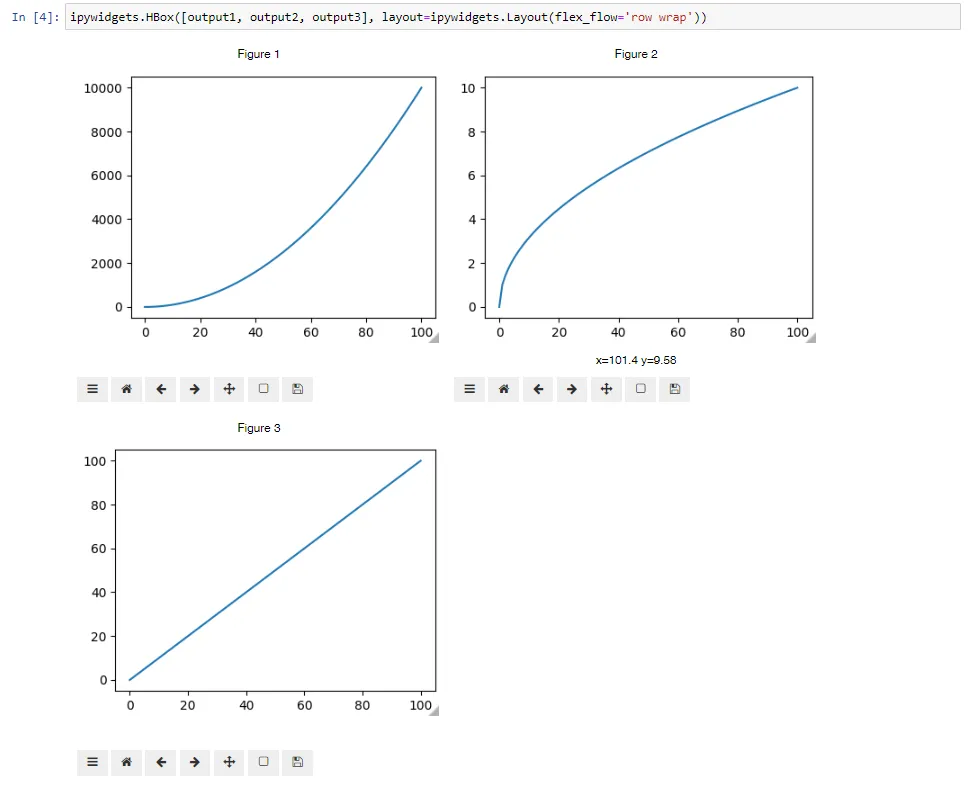
请查看https://kapernikov.com/ipywidgets-with-matplotlib/以获取更多与matplotlib相关的示例,以及https://stackoverflow.com/a/60174258/450068关于使用flex wrap的说明!
我相信没有办法在不使用subplot或grid plot方法的情况下实现。至于图表大小,您可以使用类似于ax[0].axes([.65, .6, .2, .2])或plt.subplots(1, 2, figuresize=(12,4))的方式指定它们的大小。不幸的是,这就是matplotlib的设置方式。如果您使用解释器,您可以调整GUI的大小。