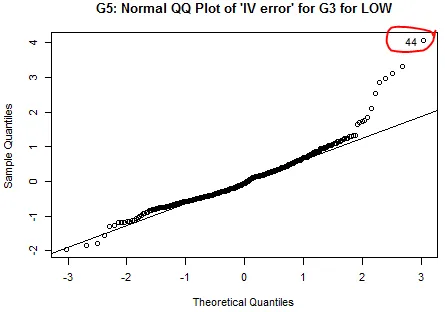
我想知道如何在R中使用qqnorm来给离群值编号(如下图所示,我已用红圆圈圈出)。
以下是一个例子。我进行了线性回归:
lm1 <- lm (y ~ x)
我接下来会绘制这个模型:
plot(lm1)
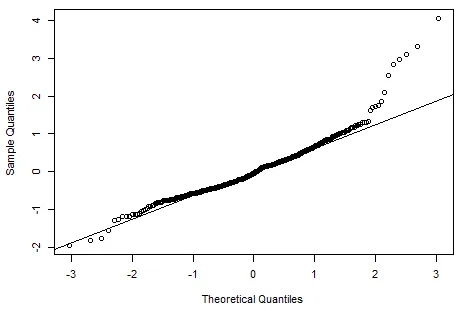
这将生成一个非常漂亮的QQ图。您可以看到它标记了异常值(我在红色圈中圈出)。
然而,如果我自己使用qqnorm,异常值没有标记编号。如何像之前的图表一样编号这些异常值?
qqnorm(y)
qqline(y)
我想知道如何在R中使用qqnorm来给离群值编号(如下图所示,我已用红圆圈圈出)。
以下是一个例子。我进行了线性回归:
lm1 <- lm (y ~ x)
plot(lm1)
qqnorm(y)
qqline(y)
还有一种非常简单的方法:
QQ_y=qqnorm(y)
identify(QQ_y)
代码将在此处暂停。将鼠标悬停在图表上,单击假设的异常值或其他感兴趣的点,然后使用控制键单击或按Esc键继续代码。
qqline(y)
 plot.lm
 # snipping the rather long output top and bottom and showing hte relevant section
 if (show[2L]) {
    ylim <- range(rs, na.rm = TRUE)
    ylim[2L] <- ylim[2L] + diff(ylim) * 0.075
    dev.hold()
    qq <- qqnorm(rs, main = main, ylab = ylab23, ylim = ylim,
        ...)
    if (qqline)
        qqline(rs, lty = 3, col = "gray50")
    if (one.fig)
        title(sub = sub.caption, ...)
    mtext(getCaption(2), 3, 0.25, cex = cex.caption)
    if (id.n > 0)
        text.id(qq$x[show.rs], qq$y[show.rs], show.rs)
    dev.flush()
根据@DWin的回答,如果我添加以下行:
text(qq$x[44]-0.2, qq$y[44], 44)
 要正确地做到这一点,您需要编写代码来:
plot(lm1, which = 2)
plot(lm1, which = 2)是什么意思? - Roman Luštrik