我正在尝试使用levelplot函数将多个格子图放入一个窗口中,通过设置par(mfrow=c(2,1))实现,但是似乎没有生效。
在lattice中有没有特定的函数可以用于设置多个图形呢?
'lattice'包是基于grid包构建的,在加载'lattice'时会附加其命名空间。但是,为了使用grid.layout函数,你需要显式地load() pkg::grid。另一个选择可能更容易的方法是使用pkg::gridExtra中的grid.arrange函数:
install.packages("gridExtra")
require(gridExtra) # also loads grid
require(lattice)
x <- seq(pi/4, 5 * pi, length.out = 100)
y <- seq(pi/4, 5 * pi, length.out = 100)
r <- as.vector(sqrt(outer(x^2, y^2, "+")))
grid <- expand.grid(x=x, y=y)
grid$z <- cos(r^2) * exp(-r/(pi^3))
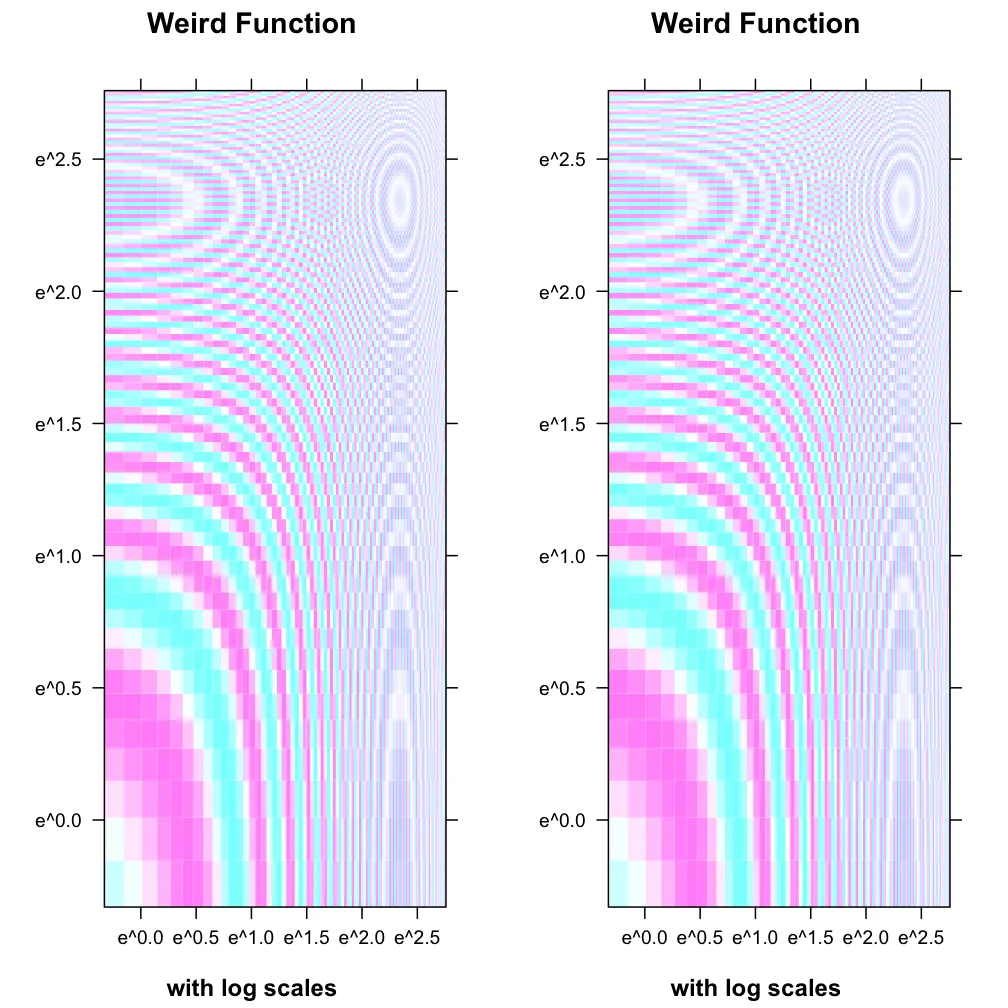
plot1 <- levelplot(z~x*y, grid, cuts = 50, scales=list(log="e"), xlab="",
ylab="", main="Weird Function", sub="with log scales",
colorkey = FALSE, region = TRUE)
plot2 <- levelplot(z~x*y, grid, cuts = 50, scales=list(log="e"), xlab="",
ylab="", main="Weird Function", sub="with log scales",
colorkey = FALSE, region = TRUE)
grid.arrange(plot1,plot2, ncol=2)
data(AirPassengers)     # a dataset supplied with base R
AP = AirPassengers      # re-bind to save some typing

# split the AP data set into two pieces
# so that we have unique data for each of the two plots
w1 = window(AP, start=c(1949, 1), end=c(1952, 1))
w2 = window(AP, start=c(1952, 1), end=c(1960, 12))

px1 = xyplot(w1)
px2 = xyplot(w2)

# arrange the two plots vertically
print(px1, position=c(0, .6, 1, 1), more=TRUE)
print(px2, position=c(0, 0, 1, .4))
?print.trellisе‡Ңж•°дёзљ„splitеЏ‚ж•°д»ӨеЏЉMurrellзљ„гЂЉRе›ңеҢұ》第5.8иЉ‚гЂ‚е…·дҢ“е†…е®№иҮ·жџӨзњ‹http://books.google.co.uk/books?id=78P4zntHHVQCгЂ‚ - Richie CottonlatticeExtra 包中的 c.trellis 快捷方式也会很有用。 - qoheleth一旦你阅读了?print.trellis,这就很容易做到了。特别感兴趣的是split参数。乍一看可能有点复杂,但一旦理解了它的含义,就相当简单了。从文档中可以看出:
split:四个整数的向量,c(x、y、nx、ny),表示在 nx × ny 的正则数组中将当前绘图定位在 x、y 位置。(注意:这个原点在左上角)
你可以在example(print.trellis)中看到一些实现,但以下是我更喜欢的一种方法:
library(lattice)

# Data
w <- as.matrix(dist(Loblolly))
x <- as.matrix(dist(HairEyeColor))
y <- as.matrix(dist(rock))
z <- as.matrix(dist(women))

# Plot assignments
pw <- levelplot(w, scales = list(draw = FALSE))  # "scales..." removes axes
px <- levelplot(x, scales = list(draw = FALSE))
py <- levelplot(y, scales = list(draw = FALSE))
pz <- levelplot(z, scales = list(draw = FALSE))

# Plot prints
print(pw, split = c(1, 1, 2, 2), more = TRUE)
print(px, split = c(2, 1, 2, 2), more = TRUE)
print(py, split = c(1, 2, 2, 2), more = TRUE)
print(pz, split = c(2, 2, 2, 2), more = FALSE)  # more = FALSE is redundant
上述代码给出了这张图:
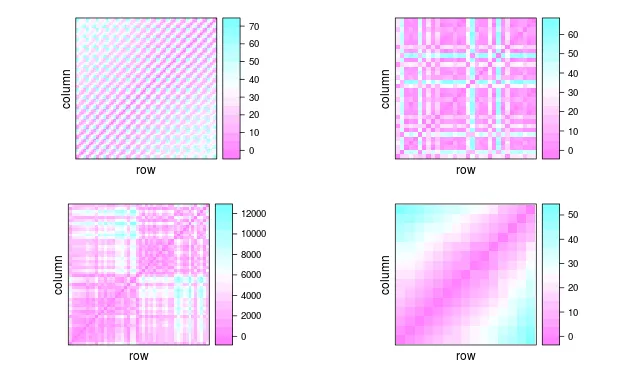
从图中可以看出,split 接受四个参数。后两个参数是你的框架大小(类似于 mfrow),而前两个参数则将您的绘图定位到 nx 乘以 ny 的框架中。
lattice图表不使用par设置。它们有自己的一套设置来自于 Grid 图形库。请参阅?trellis.par.get进行解释。 - James