我想比较两个曲线,使用R画一个图后再在其上绘制另一个图。这可能吗?如何实现?
谢谢。
谢谢。
使用基础R,您可以绘制一条曲线,然后使用lines()参数添加第二条曲线。以下是一个快速示例:
x <- 1:10
y <- x^2
y2 <- x^3

plot(x,y, type = "l")
lines(x, y2, col = "red")
另外,如果您想使用ggplot2,这里有两种方法-一种在同一图上绘制不同的颜色,另一种为每个变量生成单独的图。关键在于首先将数据“融化”为长格式。
library(ggplot2)

df <- data.frame(x, y, y2)

df.m <- melt(df, id.var = "x")

qplot(x, value, data = df.m, colour = variable, geom = "line")

qplot(x, value, data = df.m, geom = "line")+ facet_wrap(~ variable)
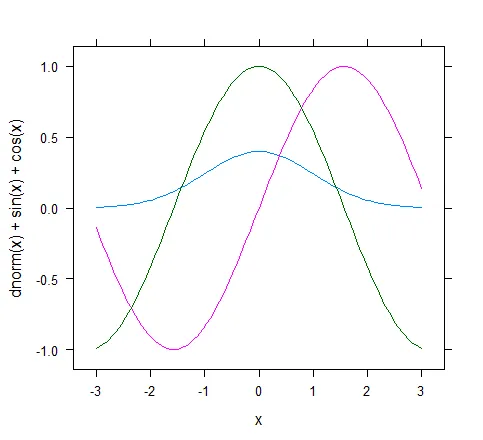
require(lattice)
x <- seq(-3,3,length.out=101)
xyplot(dnorm(x) + sin(x) + cos(x) ~ x, type = "l")
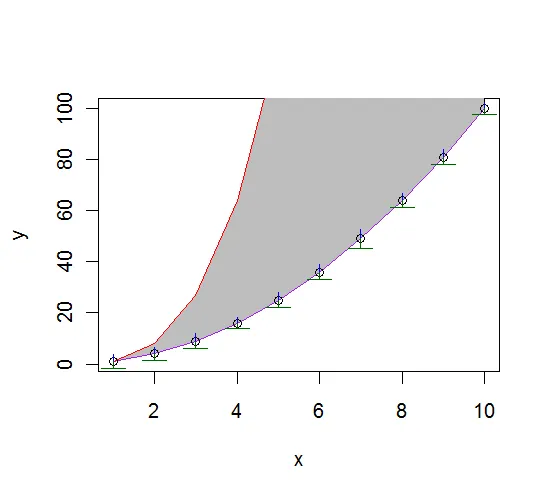
已经有一些解决方案可供您选择。如果您使用基础包,您应该熟悉以下函数:plot(),lines(),abline(),points(),polygon(),segments(), rect(), box(),arrows() ...请查看它们的帮助文件。
您应该将基础包中的图绘制为一个带有您指定坐标的窗格。在该窗格上,您可以使用上述函数绘制整个对象集。它们允许您按照所需构造图形。请记住,除非您像G博士所示那样玩弄par设置,否则每次调用plot()都会给您提供一个新的窗格。还要考虑到,事物可以绘制在其他事物之上,因此请考虑绘制事物的顺序。
例如:
set.seed(100)
x <- 1:10
y <- x^2
y2 <- x^3
yse <- abs(runif(10,2,4))

plot(x,y, type = "n")  # type="n" only plots the pane, no curves or points.

# plots the area between both curves
polygon(c(x,sort(x,decreasing=T)),c(y,sort(y2,decreasing=T)),col="grey")
# plot both curves
lines(x,y,col="purple")
lines(x, y2, col = "red")
# add the points to the first curve
points(x, y, col = "black")
# adds some lines indicating the standard error
segments(x,y,x,y+yse,col="blue")
# adds some flags indicating the standard error
arrows(x,y,x,y-yse,angle=90,length=0.1,col="darkgreen")
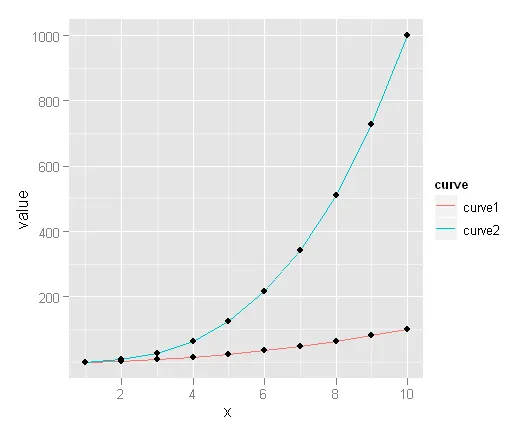
ggplot2是一个非常适合这种事情的包:
install.packages('ggplot2')
require(ggplot2)
x <- 1:10
y1 <- x^2
y2 <- x^3
df <- data.frame(x = x, curve1 = y1, curve2 = y2)
df.m <- melt(df, id.vars = 'x', variable_name = 'curve' )
# now df.m is a data frame with columns 'x', 'curve', 'value'
ggplot(df.m, aes(x,value)) + geom_line(aes(colour = curve)) +
geom_point(aes(shape=curve))
您可以轻松地获得带有不同曲线颜色和每个曲线不同点标记的绘图,并且还有一个漂亮的图例,而无需进行任何额外的工作:
ggplot后缺少一个括号,并且引用了错误的对象。这是一个可用的版本:
`
ggplot(df.m, aes(x,value)) + geom_line(aes(colour = curve)) +
geom_point(aes(shape=curve))' - Chase看一下par
> ?par
> plot(rnorm(100))
> par(new=T)
> plot(rnorm(100), col="red")