非常好的问题!我写了一个简短的函数,将目录转换成HEALPix数量计数地图:
from astropy.coordinates import SkyCoord
import healpy as hp
import numpy as np
def cat2hpx(lon, lat, nside, radec=True):
"""
Convert a catalogue to a HEALPix map of number counts per resolution
element.
Parameters
----------
lon, lat : (ndarray, ndarray)
Coordinates of the sources in degree. If radec=True, assume input is in the icrs
coordinate system. Otherwise assume input is glon, glat
nside : int
HEALPix nside of the target map
radec : bool
Switch between R.A./Dec and glon/glat as input coordinate system.
Return
------
hpx_map : ndarray
HEALPix map of the catalogue number counts in Galactic coordinates
"""
npix = hp.nside2npix(nside)
if radec:
eq = SkyCoord(lon, lat, 'icrs', unit='deg')
l, b = eq.galactic.l.value, eq.galactic.b.value
else:
l, b = lon, lat
theta = np.radians(90. - b)
phi = np.radians(l)
indices = hp.ang2pix(nside, theta, phi)
idx, counts = np.unique(indices, return_counts=True)
hpx_map = np.zeros(npix, dtype=int)
hpx_map[idx] = counts
return hpx_map
然后您可以使用此内容填充HEALPix地图:
l = np.random.uniform(-180, 180, 20000)
b = np.random.uniform(-90, 90, 20000)

hpx_map = hpx.cat2hpx(l, b, nside=32, radec=False)
在这里,nside 决定了您的像素网格是多么精细或粗糙。
hp.mollview(np.log10(hpx_map+1))
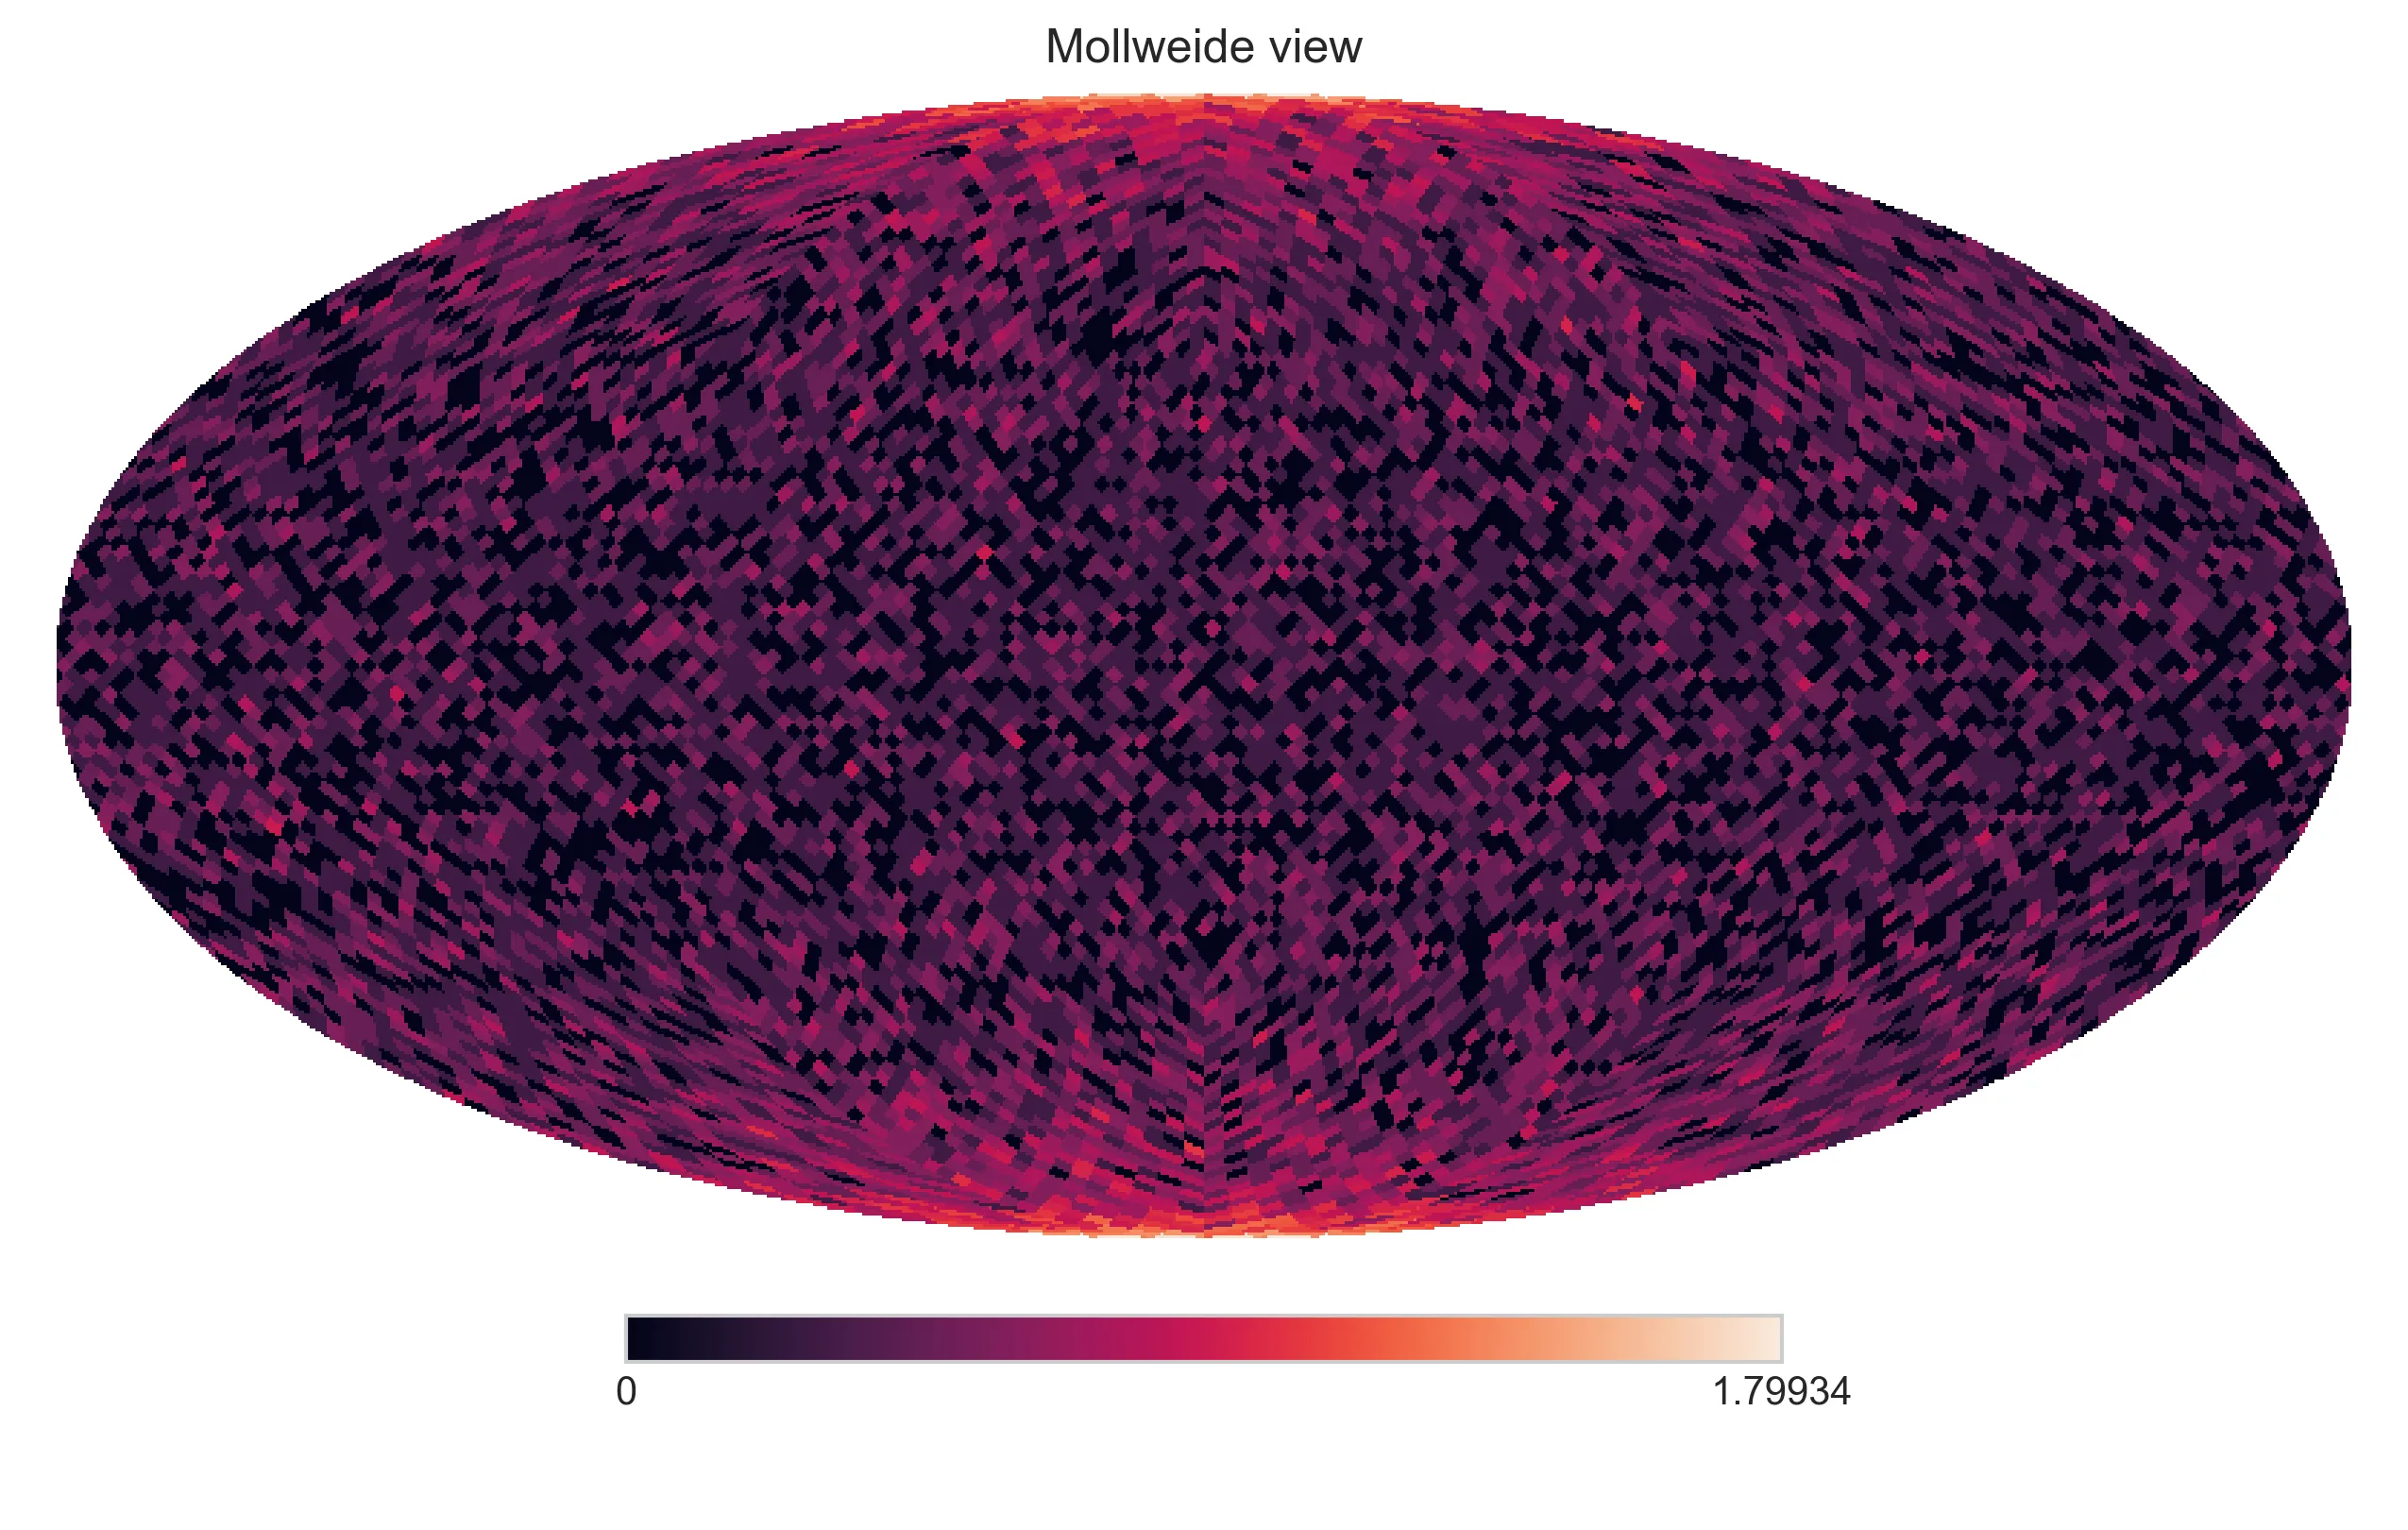
还要注意的是,如果按银道纬度均匀采样,您会更倾向于选择银河极点的数据点。如果想避免这种情况,可以通过余弦函数进行缩放。
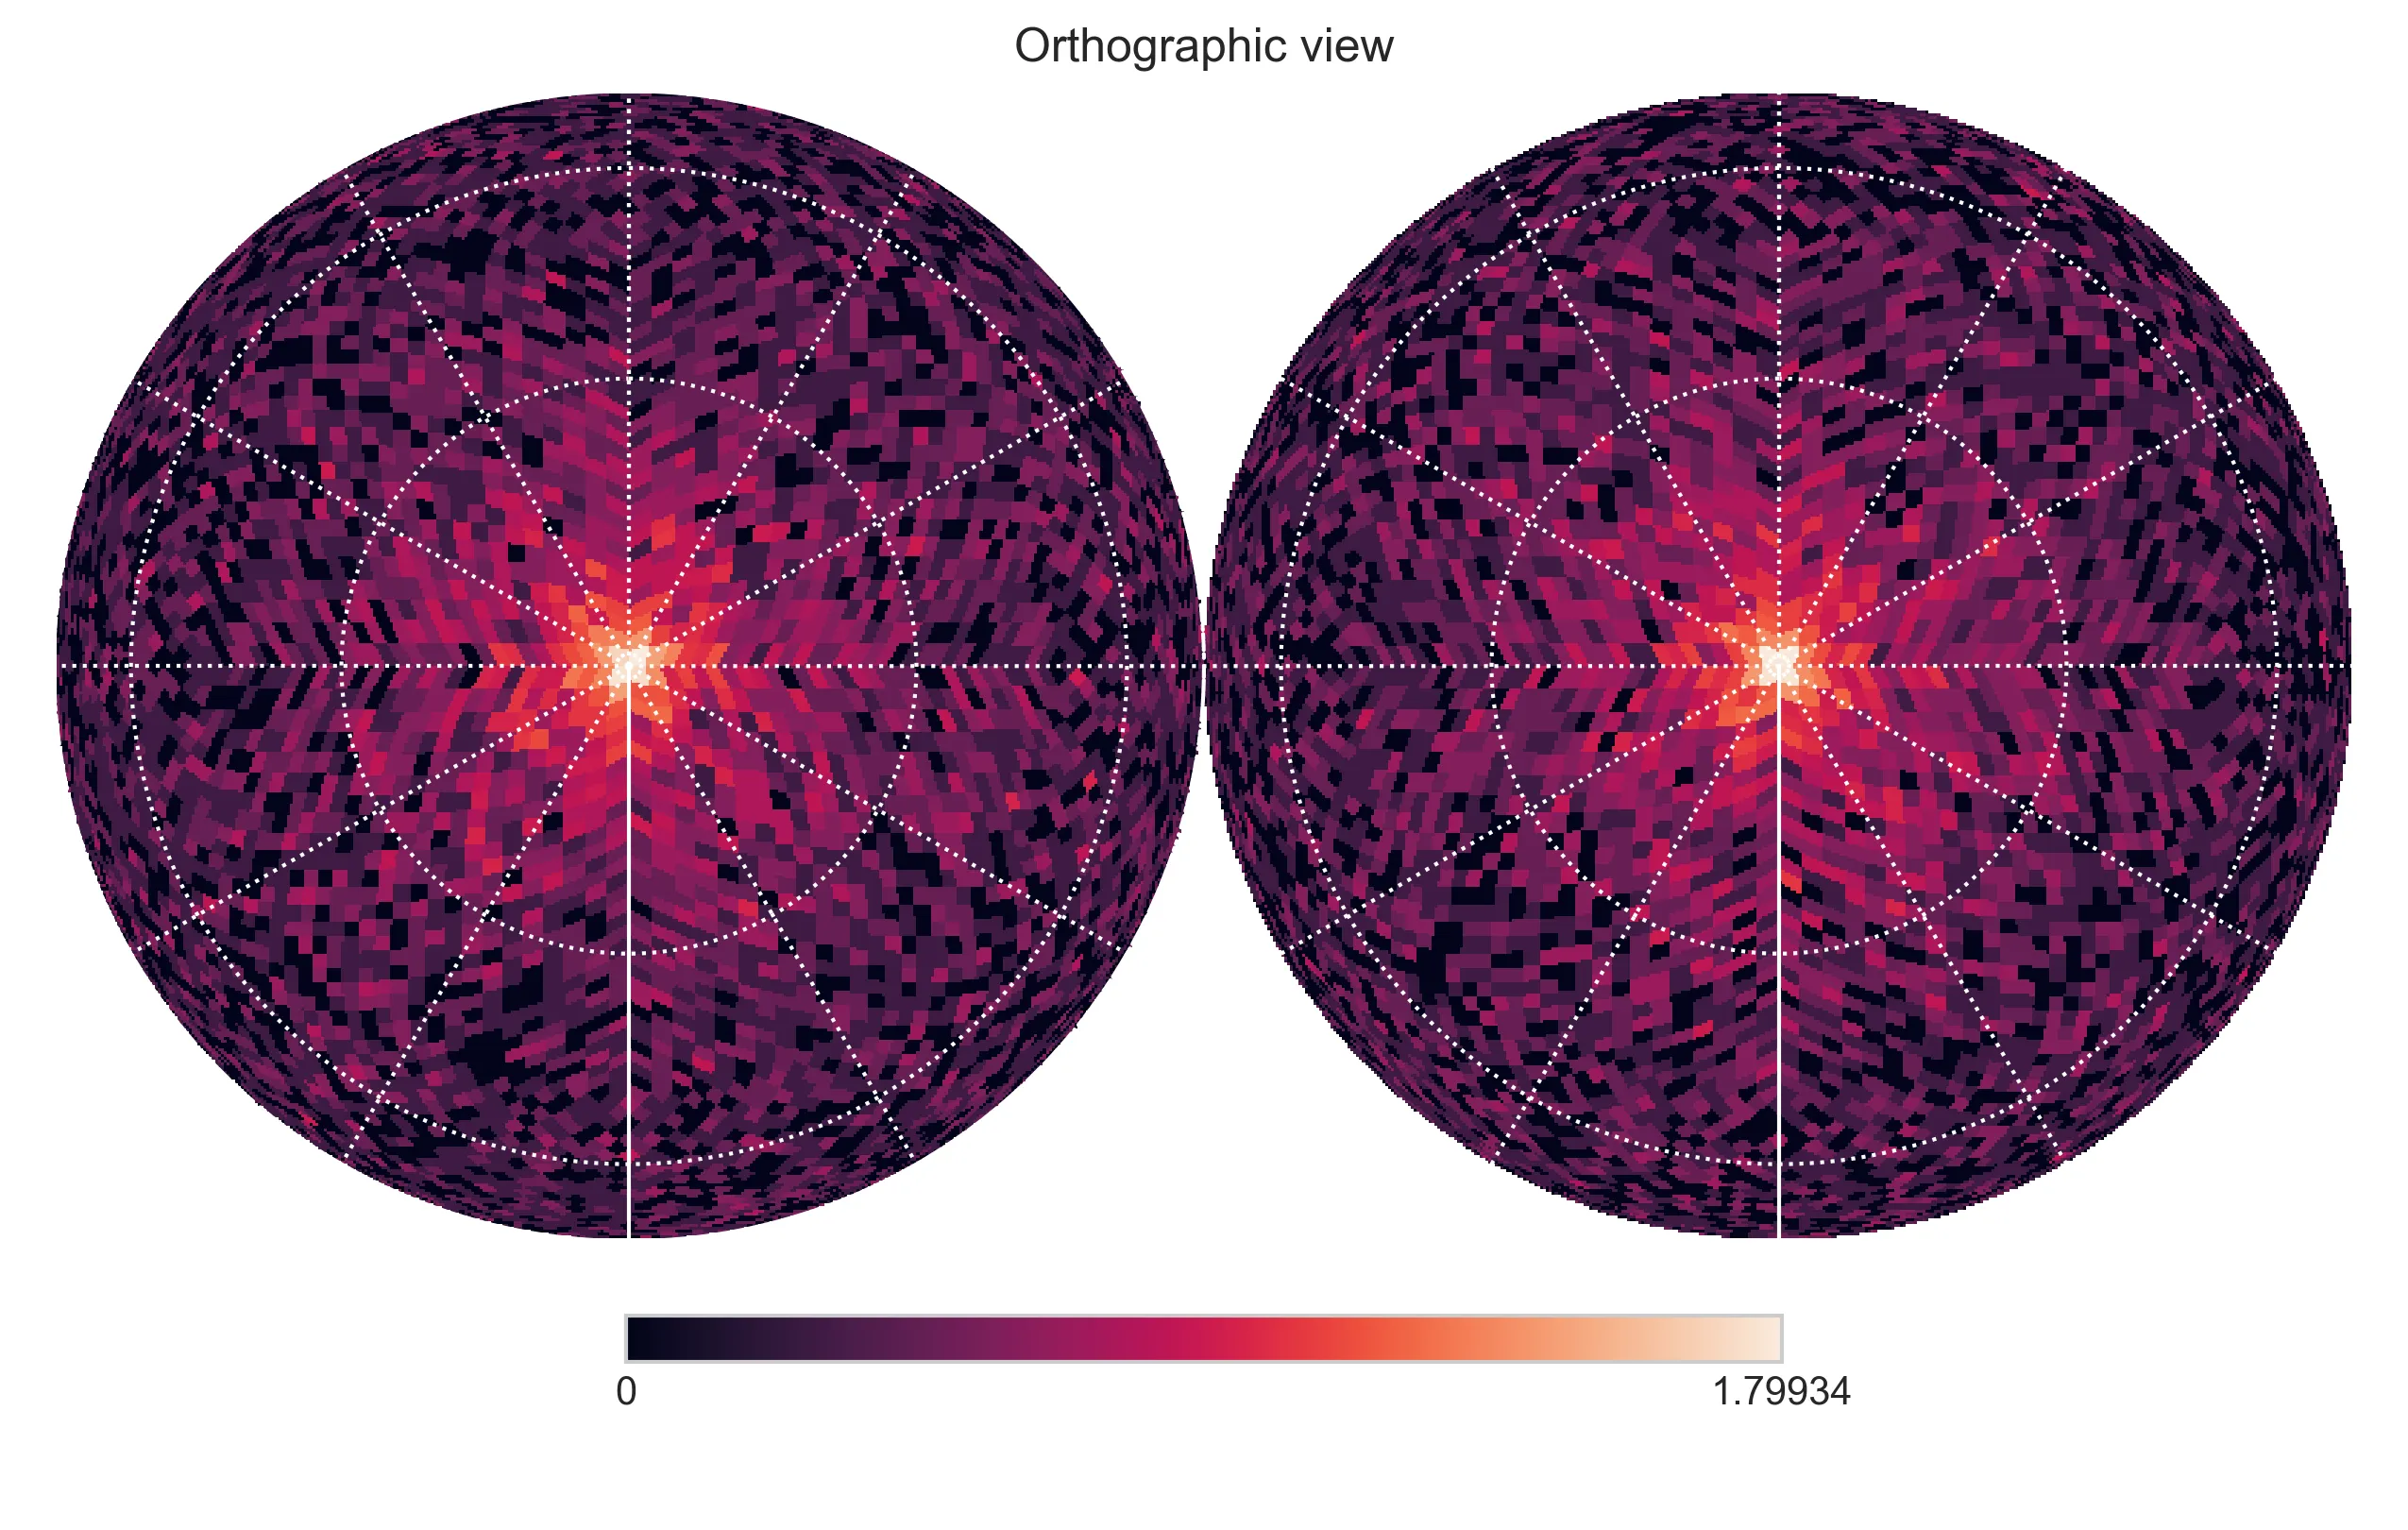
hp.orthview(np.log10(hpx_map+1), rot=[0, 90])
hp.graticule(color='white')