我是R语言的新手,我已经编写了下面的交互图表,我想要两条虚线分别连接"coral"和"darkgoldenrod2"的点:
df <- tibble::tribble(~Proportion, ~Lower,~Upper, ~Area,~Time,
                      invlogit(-0.033886), invlogit(-0.517223067), invlogit(0.449451067), "SNP", "Day",
                      (invlogit(-0.9231219)+invlogit(-0.3786)), 0.5727 ,0.8087, "SNP", "Night",
                      invlogit(-0.9231219), invlogit(-1.406458967), invlogit(-0.439784833),"LGCA", "Day",
                      invlogit(-0.1604356), invlogit(-0.643772667) ,invlogit(0.322901467), "LGCA","Night")
df


dfnew <- df %>%
  mutate(ymin = Proportion - Lower,
         ymax = Proportion + Upper)

p <-   ggplot(data = dfnew, aes(x = Time, y = Proportion, color=Area)) +

  geom_point(size = 6, stroke = 0, shape = 16,
             position = position_dodge(width = 0.1))+
  geom_errorbar(aes(y=Proportion, ymin = Lower, ymax = Upper),width=0.1,size=1,
                position = position_dodge(width = 0.1)) +
  theme(axis.text=element_text(size=15),
        axis.title=element_text(size=20)) +
  scale_color_manual(values = c("SNP" = "coral",
                                "LGCA" = "darkgoldenrod2"))
p
在Stack Overflow上阅读其他帖子后,我使用了命令行:+geom_line(aes(group = 1),size=2)
然而,如下所示的图表并不符合要求: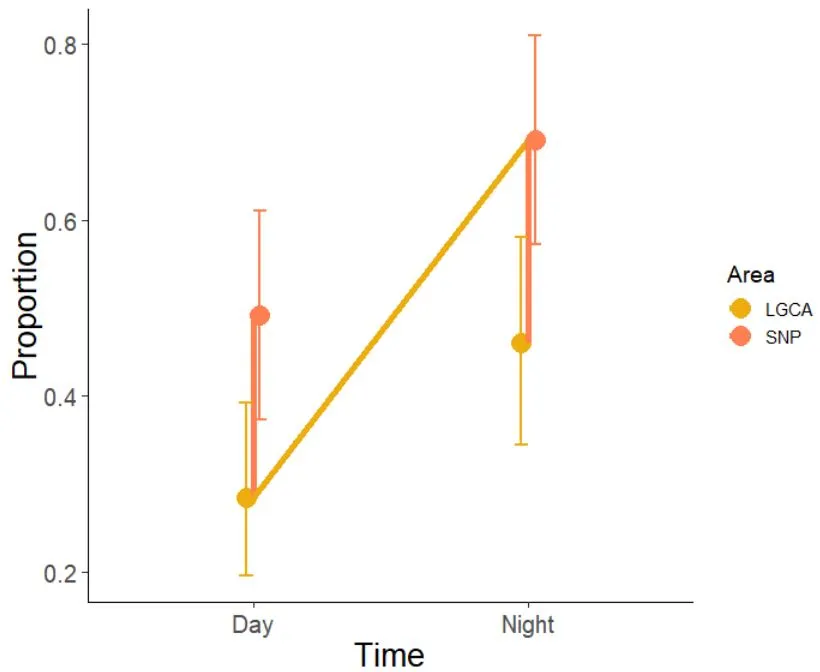
非常感谢您对此的任何帮助!
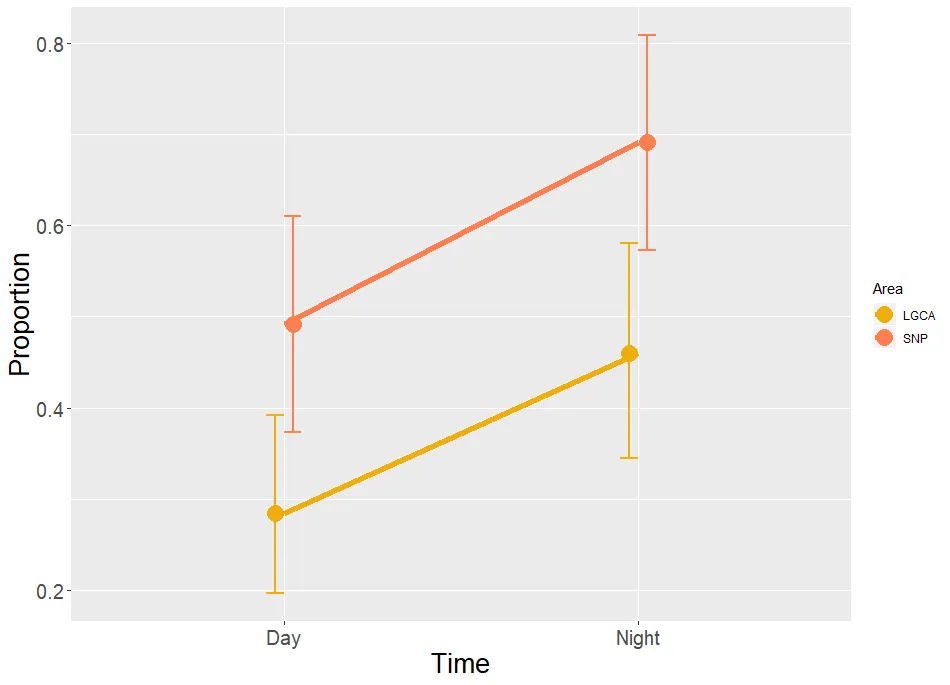
geom_line(size=2, linetype="dotted")。 - Arienrhod