Python Pandas散点图错误:这是Pandas的一个bug吗?

3

似乎无法让pandas制作散点图:

尝试制作散点图,但一直收到此错误:

 TypeError: only length-1 arrays can be converted to Python scalars

基本示例:

 x= self.df['he']
 y= self.df['xy']
 sct = plt.scatter(x,y)

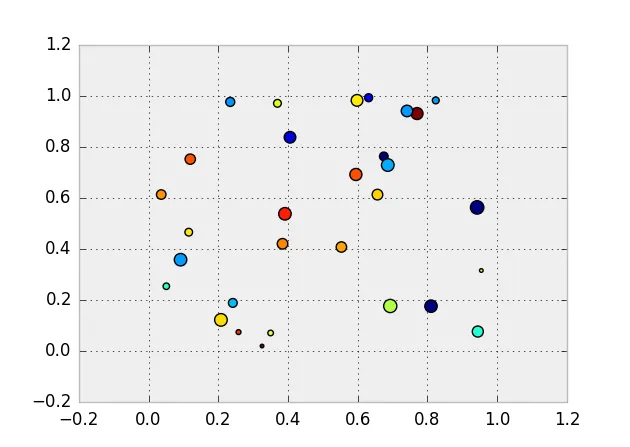
我正在尝试制作一个气泡图(带有颜色和大小的散点图),需要4个额外参数。

气泡图示例:

color = self.df['clr'].values
size =  self.df['sze'].values
sct = plt.scatter(x, y, c=clr, s=size, linewidths=2, edgecolor='w')

无论是简单的散点图还是复杂的气泡图,都无法消除这个错误。

TypeError: only length-1 arrays can be converted to Python scalars 

非常感谢您的提问: 这是Pandas中的一个错误吗?Matplotlib也会报错吗? -最好


1
你能否发布一些样本数据,以便可以复现此问题吗? - Greg Reda
1个回答

1

使用 pandas 0.12matplotlib 1.3 版本,当你将DataFrame的列作为参数传递给散点图时,应该可以工作:

In [18]: df = pd.DataFrame(np.random.rand(15, 4), columns=list('abcd'))

In [19]: plt.scatter(df.a, df.b, c=df.c, s=df.d*100)
Out[19]: <matplotlib.collections.PathCollection at 0x380e050>

pandas scatter example

也许你正在使用旧版本或者使用了“特殊”的数据。

对于 pandas 0.13 版本,有一个未合并的 pull request,将在 df.plot 中添加“scatter”作为一个选项,因此以下代码应该是等价的:

df.plot(kind='scatter', x='a', y='b', c='c', s=df.d * 100)  

网页内容由stack overflow 提供, 点击上面的
可以查看英文原文,
原文链接