我注意到在
这是我的数据集:
ggplot2的geom_path()中有一种奇怪的行为。我不确定我是在做错了什么还是这是个bug。这是我的数据集:
x <- abs(rnorm(10))
y <- abs(rnorm(10)/10)
categs <- c("a","b","c","d","e","f","g","h","i","j")

df <- data.frame(x,y,categs)
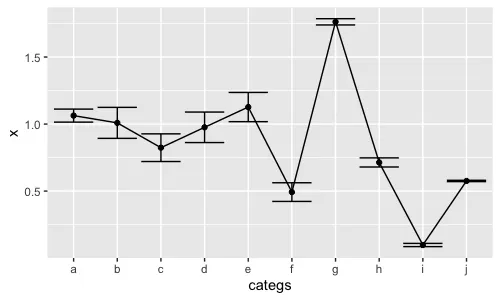
我用点绘制了一个图,然后使用 geom_path 将它们连接起来。效果不错:
ggplot(df, aes(categs, x, group=1)) + geom_point() + geom_errorbar(aes(ymin=x-y, ymax=x+y)) + geom_path()
df$categs <- factor(df$categs, levels = c("f","i","c","g","e","a","d","h","b","j"))
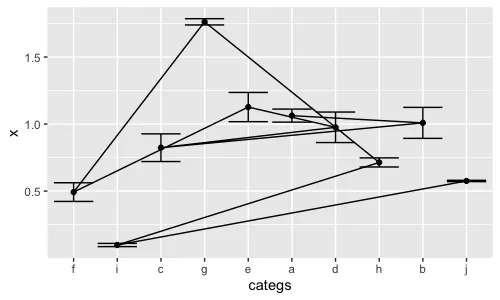
然后geom_plot仍然保持原始顺序(尽管因子水平的顺序已在x轴上更新)。
你猜我做错了什么吗?谢谢。