我试图将一些几何点或坐标映射到斯里兰卡国家地图上。我能够按预期绘制区域边界和人口,但是我无法将几何点绘制在地图上。
安装包
devtools::install_github("thiyangt/ceylon")
加载软件包
library("ceylon")
library(tidyverse)
library(sp)
library(viridis)

data(sf_sl_0)
仅映射斯里兰卡
ggplot(sf_sl_0) + geom_sf()
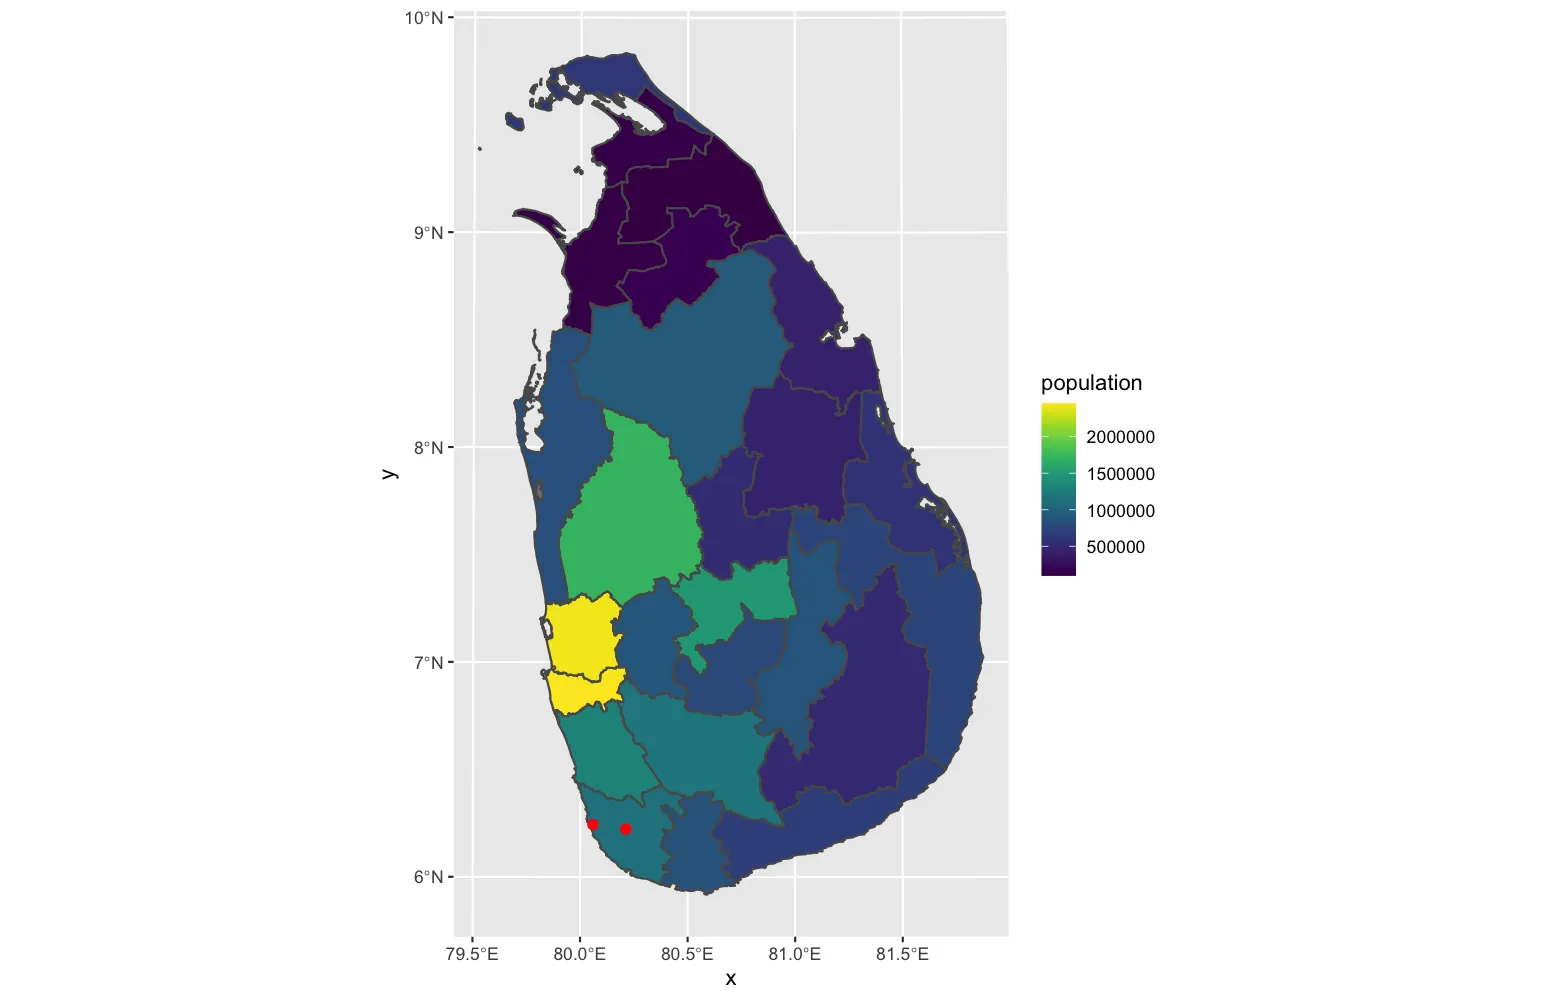
在斯里兰卡绘制行政区划地图+人口统计
ggplot(district) + geom_sf(aes(fill = population), show.legend = TRUE) + scale_fill_viridis()
将特定的地理坐标映射到斯里兰卡区域地图上
我希望将以下这些坐标映射到地图中(是的,它们肯定在斯里兰卡境内)
df_cord <- data.frame (lat  = c("6.2441521", "6.2234515"),
                  lon = c("80.0590804", "80.2126109"))
我尝试过:
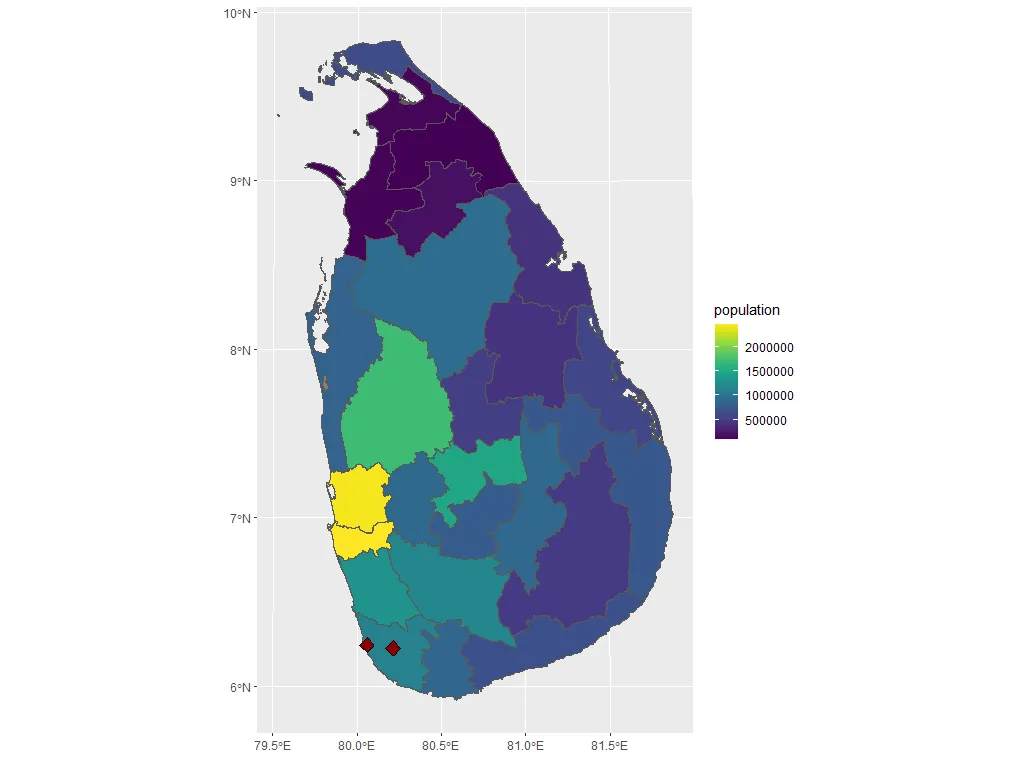
ggplot(district) +
  geom_sf(df_cord) +  scale_fill_viridis() +
  geom_point(
    data = df_cord,
    aes(x = lon, y = lat),
    size = 4,
    shape = 23,
    fill = "darkred"
  )
但是我遇到了一个错误:validate_mapping() 中的错误:
!mapping 必须由 aes() 创建
看起来我可能需要找到每个几何点的 x,y 坐标,然后再使用 cord_sf 进行映射?但是我无法弄清楚如何做到这一点。我发现了一个很酷的函数叫做 usmap::usmap_transform,它可以将美国几何点转换为 x,y 坐标... 但我无法弄清楚如何在斯里兰卡地图上实现相同的功能。
我对地图制作非常陌生--请问有人可以给予建议吗?非常感谢!我也会接受其他方法/解决方案的建议!
check_aesthetics()中的错误: !美学元素必须是长度为1或与数据(26)相同:x和y。 - NewBeevalidate_mapping()中遇到错误: !mapping必须由aes()创建 - NewBee