在R中将纬度/经度点映射到形状文件

4

我正在尝试使用一个shapefile为每组经纬度坐标识别邮政编码。

经纬度数据提取自: https://data.cityofchicago.org/Public-Safety/Crimes-2017/d62x-nvdr (Crimes_-_2001_to_present.csv)

Shapefile: https://www2.census.gov/geo/tiger/PREVGENZ/zt/z500shp/ zt17_d00.shp (伊利诺伊州邮政编码定义)

library(rgeos)
library(maptools)

ccs<-read.csv("Crimes_-_2001_to_present.csv")
zip.map <- readOGR("zt17_d00.shp")
latlon<-ccs[,c(20,21)]
str(latlon)
   'data.frame':   6411517 obs. of  2 variables:
    $ Latitude : num  42 41.7 41.9 41.8 42 ...
    $ Longitude: num  -87.7 -87.6 -87.7 -87.6 -87.7 ...
coordinates(latlon) = ~Longitude+Latitude
write.csv(cbind(latlon,over(zip.map,latlon)),"zip.match.csv")

这是我收到的错误信息:

错误在 (function (classes, fdef, mtable)中: 无法找到一个适用于签名为“"SpatialPolygonsDataFrame", "data.frame"”的函数“over”的继承方法。

我缺少了什么?任何帮助都将不胜感激!

你正在尝试从CSV和SpatialPolygonsDataFrame创建逗号分隔的文件,它们具有完全不同的维度。你需要以不同的方式将数据与SPDF文件组合。尝试与我们分享str(zip.map)输出以及绑定的目的是什么。我最终明白你在寻找什么,但cbind如何超越你的方法来实现这一点?如果我能看到数据,我可能能够帮助你。 - sconfluentus
我没有针对你的数据尝试过这个方法,但你可能想在splancs包中查找?inout。这是一种测试一组点是否落在多边形(shapefile)内的方法,这可能会让你更接近你所需要的东西。很抱歉这不是确切的解决方案。 - Rich Pauloo
1个回答

13

从错误信息来看,似乎你的coordinates(latlon) = ~Longitude+Latitude代码行未能成功将数据框转换为空间对象。在进行转换后,你可能需要通过class(latlon)调用检查一下。

此外,最好绘制形状文件并将其与latlon层叠加,以确保数据集实际重叠。如果它们没有重叠,请检查它们是否共享相同的投影(sp::identicalCRS)。

以下是使用虚拟数据的示例,因为问题中的形状文件链接无法工作。

library(rgdal)

# load Scotland shapefile, which came with the package
dsn <- system.file("vectors", package = "rgdal")[1]
shapefile <- readOGR(dsn=dsn, layer="scot_BNG")
shapefile <- spTransform(shapefile, CRS("+proj=longlat +datum=WGS84")) #change CRS

# create dummy data frame with coordinates in Scotland (I clicked randomly on Google Maps)
csvfile <- data.frame(lat = c(-4.952, -4.359, -2.425),
                      long = c(57.57, 56.59, 57.56))

# convert data frame to SpatialPoints class
coordinates(csvfile) <- ~lat+long

# make sure the two files share the same CRS
csvfile@proj4string <- shapefile@proj4string

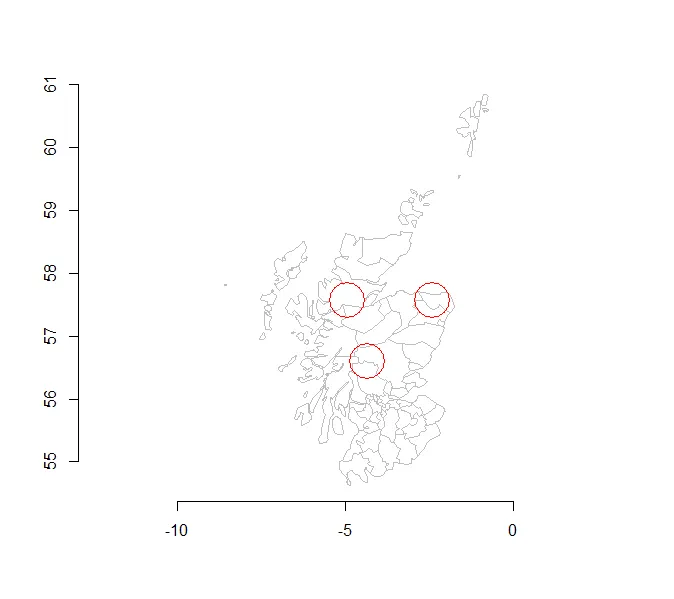
# visual check
plot(shapefile, border = "grey")
points(csvfile, col = "red", cex = 5)
axis(1) # showing the axes helps to check whether the coordinates are what you expected
axis(2)

视觉检查

# if everything works out so far, the following should work
points_in_shape <- over(csvfile, shapefile)

> points_in_shape
  SP_ID          NAME ID_x COUNT   SMR  LONG  LAT     PY EXP_ AFF   X_COOR   Y_COOR ID_y
1    50 Ross-Cromarty    5    15 352.1 57.71 5.09 129271  4.3  10 220678.6 870935.6    5
2    11 Perth-Kinross   29    16 111.3 56.60 4.09 346041 14.4  10 291372.7 746260.5   29
3     3  Banff-Buchan    2    39 450.3 57.56 2.36 231337  8.7  16 385776.1 852378.2    2

> cbind(csvfile, points_in_shape["NAME"])
     lat  long          NAME
1 -4.952 57.57 Ross-Cromarty
2 -4.359 56.59 Perth-Kinross
3 -2.425 57.56  Banff-Buchan

感谢Z. Lin的帮助!你是对的,我的coordinates()转换没有正确地转换为空间对象 - 我在lat/lon数据中漏掉了一些null... 一旦我解决了这个问题并按照你清晰阐述的所有其他有用步骤操作,它就起作用了。谢谢!!! - IsisDorus

网页内容由stack overflow 提供, 点击上面的
可以查看英文原文,
原文链接