我最近才开始使用Bokeh。我有一个散点图,我想根据第三个属性(比如数量,其中x轴是日期,y轴是该时间点的给定值)为每个标记着色。
假设我的数据在一个数据框中,我用线性颜色映射实现了这一点,如下所示:
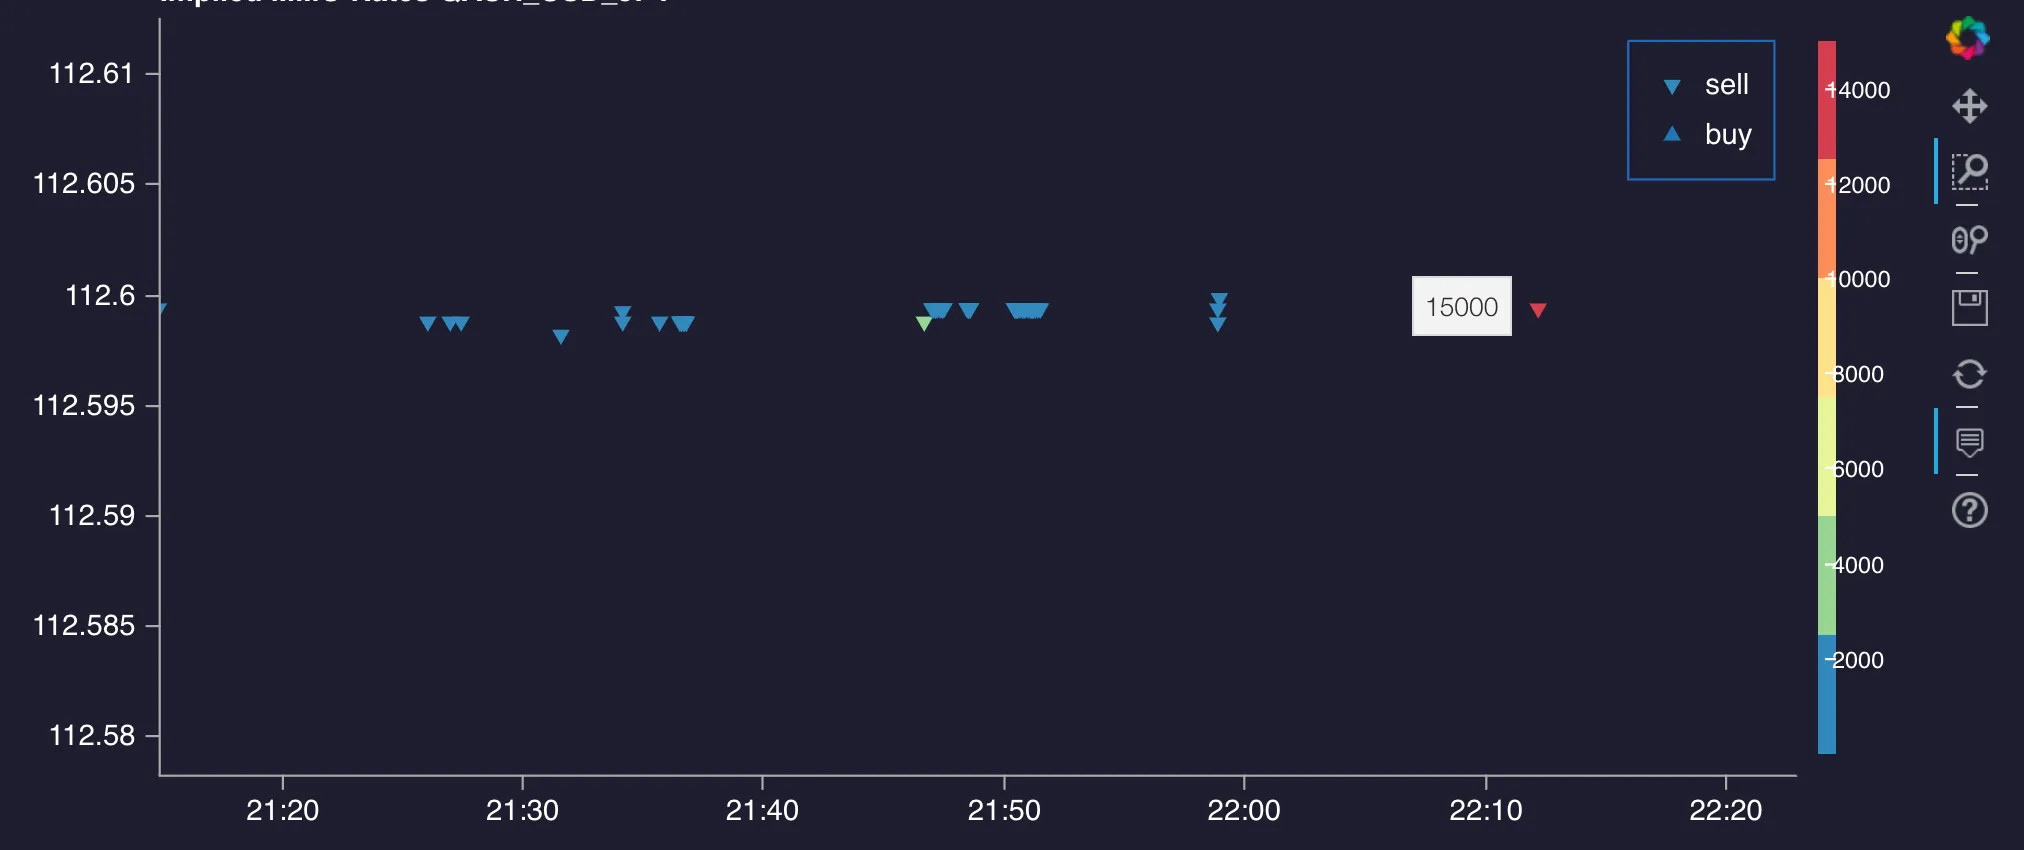
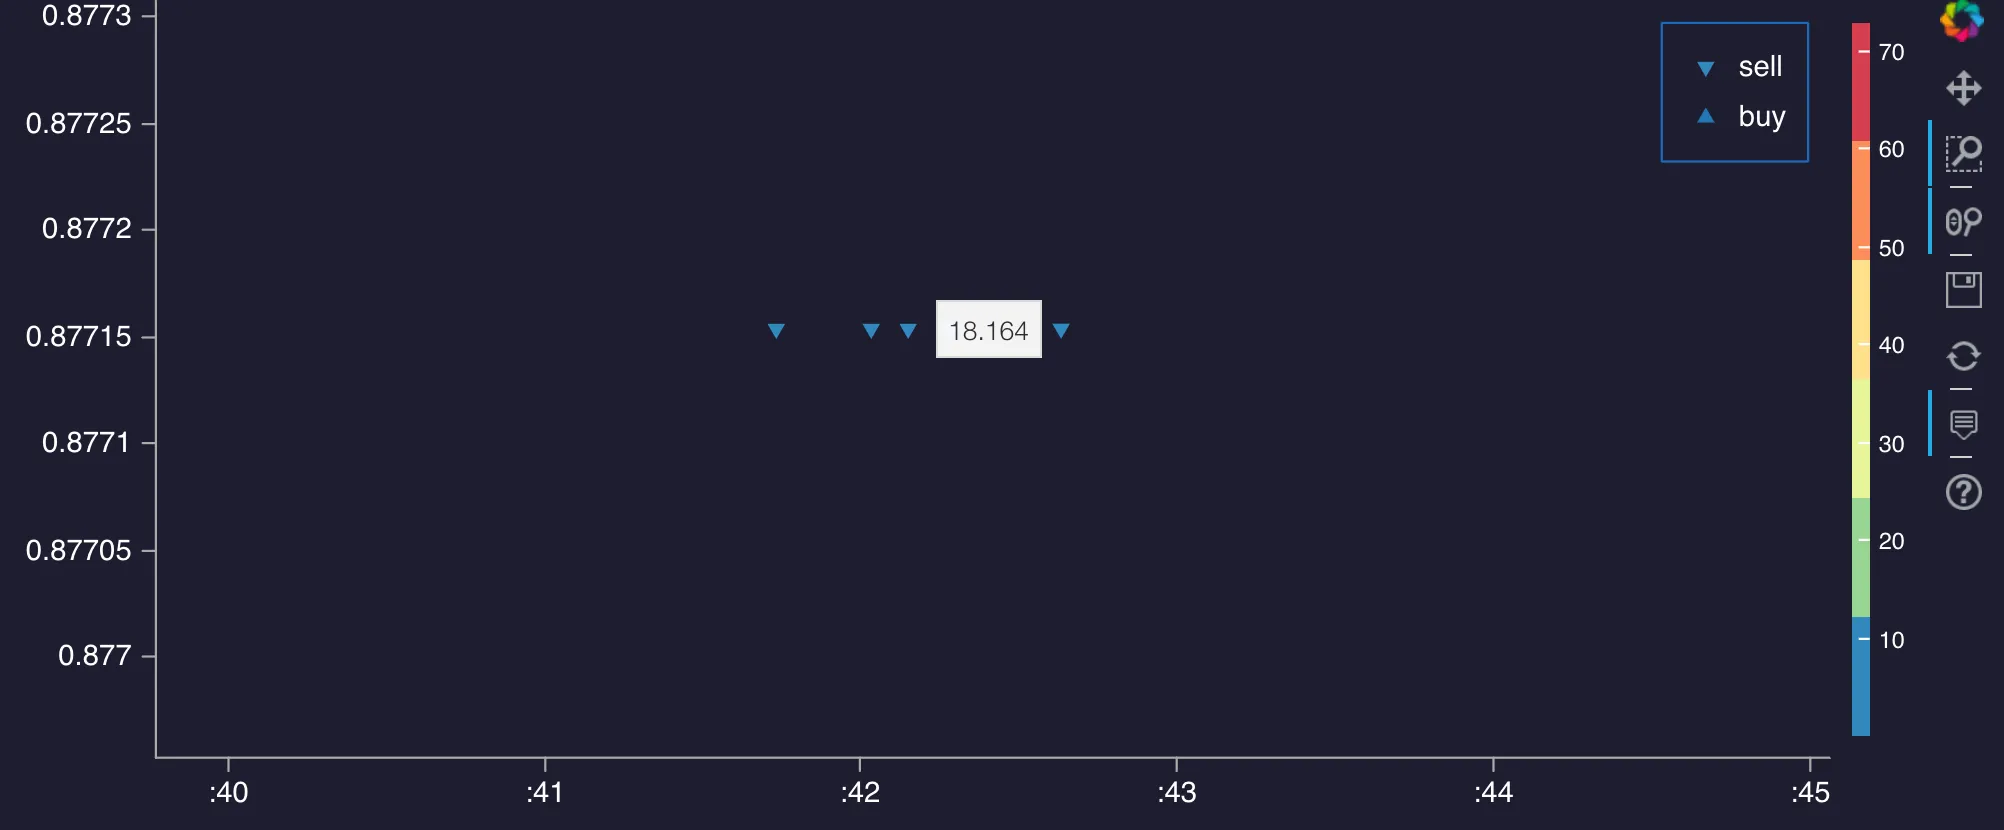
这是我能找到的最接近的。颜色图随着新值的更新而更新,但似乎标记的颜色仍然遵循原始模式。请参见下面的图片(鉴于数量,我希望是绿色,但它是蓝色的,因为它仍然被视为小于4000,就像在回调之前的第一个情节的地图中一样)。
更新后,圆圈的颜色将根据原始比例进行着色:大于10的所有内容将变为红色。相反,我希望在最后3个圆圈上方之前一切都是蓝色,最后3个圆圈应分别着以绿色、黄色和红色。
假设我的数据在一个数据框中,我用线性颜色映射实现了这一点,如下所示:
min_q = df.quantity.min()
max_q = df.quantity.max()
mapper = linear_cmap(field_name='quantity', palette=palettes.Spectral6, low=min_q, high=max_q)
source = ColumnDataSource(data=get_data(df))

p = figure(x_axis_type="datetime")
p.scatter(x="date_column", y="value", marker="triangle", fill_color=mapper, line_color=None, source=source)
color_bar = ColorBar(color_mapper=mapper['transform'], width=8,  location=(0,0))
p.add_layout(color_bar, 'right')
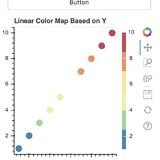
这似乎按预期工作。下面是我启动bokeh服务器后得到的图表。
然后我有一个回调函数update(),在某个小部件(选择器或时间选择器)的值改变时触发。
def update():
    # get new df (according to new date/select)
    df = get_df()
    # update min/max for colormap
    min_q = df.quantity.min()
    max_q = df.quantity.max()
    # I think I should not create a new mapper but doing so I get closer
    mapper = linear_cmap(field_name='quantity', palette=palettes.Spectral6 ,low=min_q, high=max_q)
    color_bar.color_mapper=mapper['transform']
    source.data = get_data(df)
    # etc
这是我能找到的最接近的。颜色图随着新值的更新而更新,但似乎标记的颜色仍然遵循原始模式。请参见下面的图片(鉴于数量,我希望是绿色,但它是蓝色的,因为它仍然被视为小于4000,就像在回调之前的第一个情节的地图中一样)。
我应该只需在数据框中添加一个“颜色”列吗?我感觉有一种更简单/更方便的方法可以做到这一点。
编辑: 这里是使用bigreddot回答的最小工作示例:
from bokeh.io import curdoc
from bokeh.layouts import column
from bokeh.plotting import figure
from bokeh.models import Button, ColumnDataSource, ColorBar, HoverTool
from bokeh.palettes import Spectral6
from bokeh.transform import linear_cmap
import numpy as np

x = [1,2,3,4,5,7,8,9,10]
y = [1,2,3,4,5,7,8,9,10]
z = [1,2,3,4,5,7,8,9,10]


source = ColumnDataSource(dict(x=x, y=y, z=z))

#Use the field name of the column source
mapper = linear_cmap(field_name='z', palette=Spectral6 ,low=min(y) ,high=max(y))

p = figure(plot_width=300, plot_height=300, title="Linear Color Map Based on Y")
p.circle(x='x', y='y', line_color=mapper,color=mapper, fill_alpha=1, size=12, source=source)

color_bar = ColorBar(color_mapper=mapper['transform'], width=8,  location=(0,0))
p.add_tools(HoverTool(tooltips="@z", show_arrow=False, point_policy='follow_mouse'))
p.add_layout(color_bar, 'right')

b = Button()

def update():
    new_z = np.exp2(z)
    mapper = linear_cmap(field_name='z', palette=Spectral6 ,low=min(new_z), high=max(new_z))
    color_bar.color_mapper=mapper['transform']
    source.data = dict(x=x, y=y, z=new_z)

b.on_click(update)

curdoc().add_root(column(b, p))
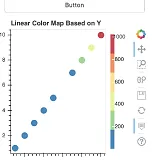
更新后,圆圈的颜色将根据原始比例进行着色:大于10的所有内容将变为红色。相反,我希望在最后3个圆圈上方之前一切都是蓝色,最后3个圆圈应分别着以绿色、黄色和红色。