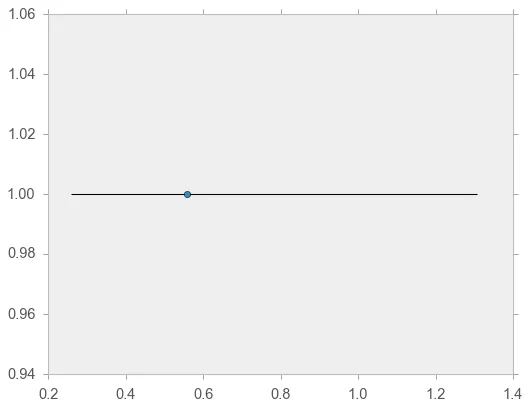
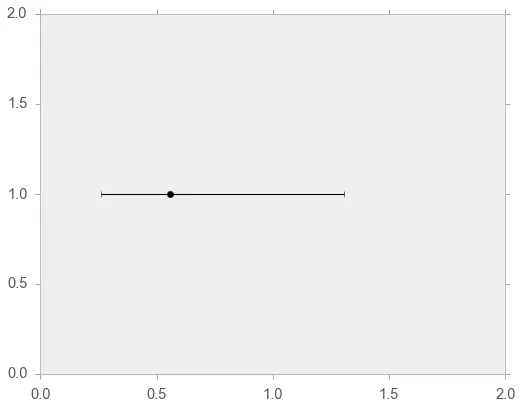
目标:使用errorbar绘制单个点的非对称x误差线。我想显示数据集的四分位距(IQR)。
代码:
import numpy as np
import matplotlib.pyplot as plt

y = 1.0
data = np.random.rand(100)

median = np.median(data)
upper_quartile = np.percentile(data, 75)
lower_quartile = np.percentile(data, 25)
IQR = upper_quartile - lower_quartile

plt.errorbar(median, y, xerr=[lower_quartile ,upper_quartile], fmt='k--')

plt.savefig('IQR.eps')
plt.show()
错误:
Traceback (most recent call last):
  File "IQR.py", line 15, in <module>
    plt.errorbar(median, y, xerr=[0.5,0.75], fmt='k--')
  File "/usr/lib/pymodules/python2.7/matplotlib/pyplot.py", line 2251, in errorbar
    ret = ax.errorbar(x, y, yerr, xerr, fmt, ecolor, elinewidth, capsize, barsabove, lolims, uplims, xlolims, xuplims, **kwargs)
  File "/usr/lib/pymodules/python2.7/matplotlib/axes.py", line 5327, in errorbar
    in cbook.safezip(x,xerr)]
  File "/usr/lib/pymodules/python2.7/matplotlib/cbook.py", line 1294, in safezip
    raise ValueError(_safezip_msg % (Nx, i+1, len(arg)))
ValueError: In safezip, len(args[0])=1 but len(args[1])=2
我的问题是我无法为单个点创建不对称的误差线,其中该点将代表均值,误差线的上限和下限将分别为上四分位数和下四分位数。