我使用GADM数据绘制了俄罗斯地区的地图:
setwd("~/Desktop/Master thesis/")
library(sp)
library(RColorBrewer)
library(raster)
data <- getData('GADM', country='RUS', level=1)
#exclude columns I don't need
data <- data[,-c(2,3,4,5,7,8,9,10,11,12,13)]
data$region <- as.factor(iconv(as.character(data$NAME_1)))
png(file = "~/Desktop/myplot2.png", width = 1300, height = 700, units = "px")
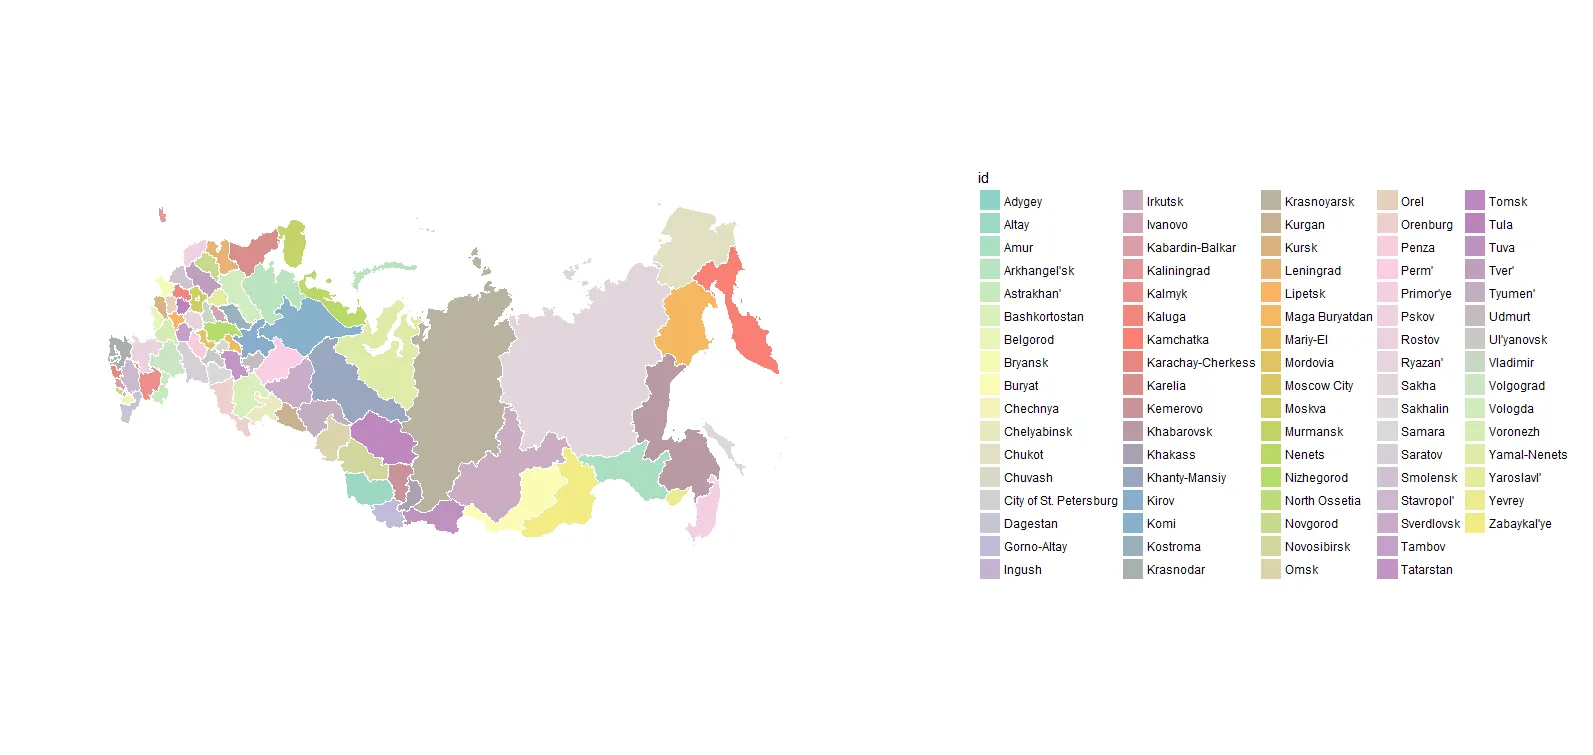
spplot(data, "region", xlim=c(15,190), ylim=c(40,83), col.regions = colorRampPalette(brewer.pal(12, "Set3"))(85), col = "white")
dev.off()
我得到的地图:
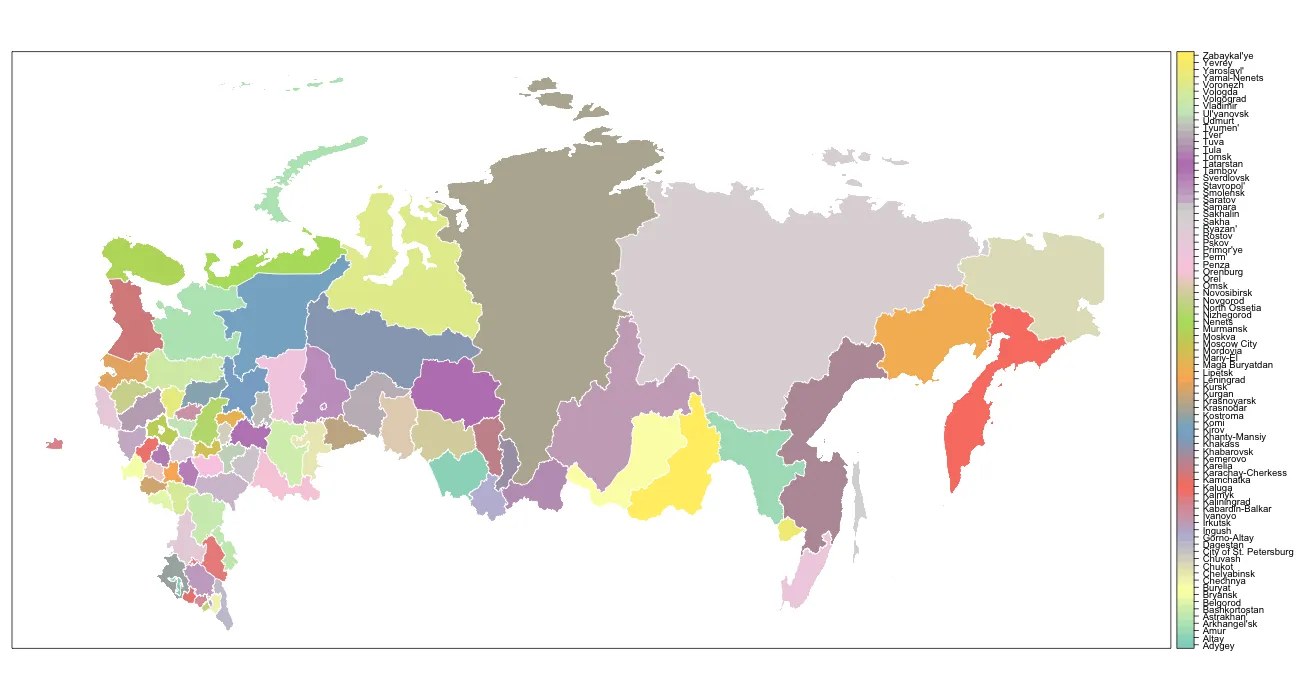
我得到的地图太“平坦”,看起来不像维基百科上的地图。由于地球的圆形,地图的左右两侧应该稍微倾斜。
维基百科上的地图:
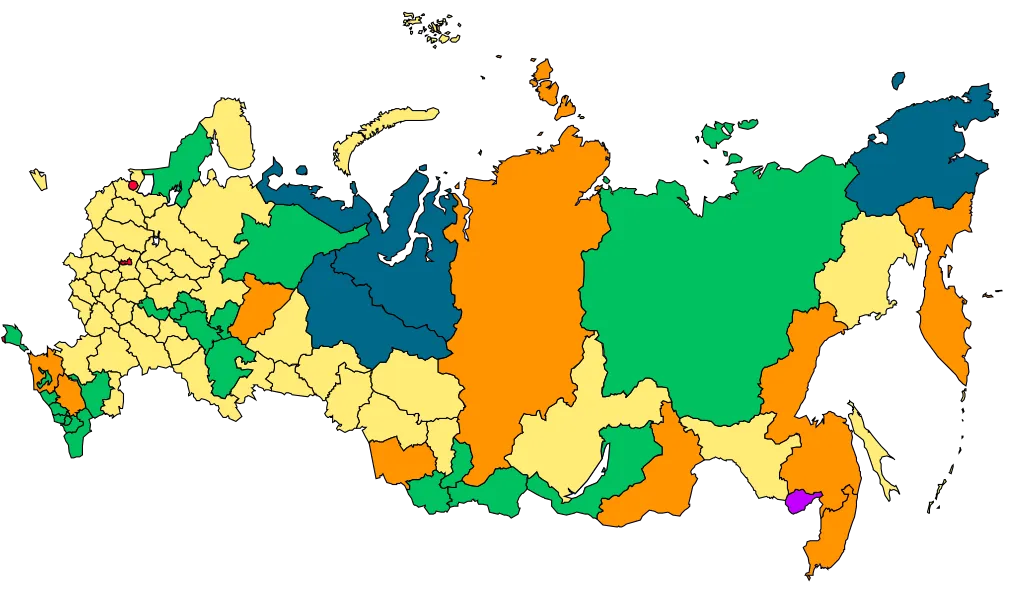
有没有办法让它更像地球呢?