我在R中使用randomForest函数创建了一个随机森林预测模型:
model = randomForest(classification ~., data=train, ntree=100, proximity=T)
接下来,我绘制了该模型以查看模型的整体误差:
plot(model, log="y")
这给我下面的图表:
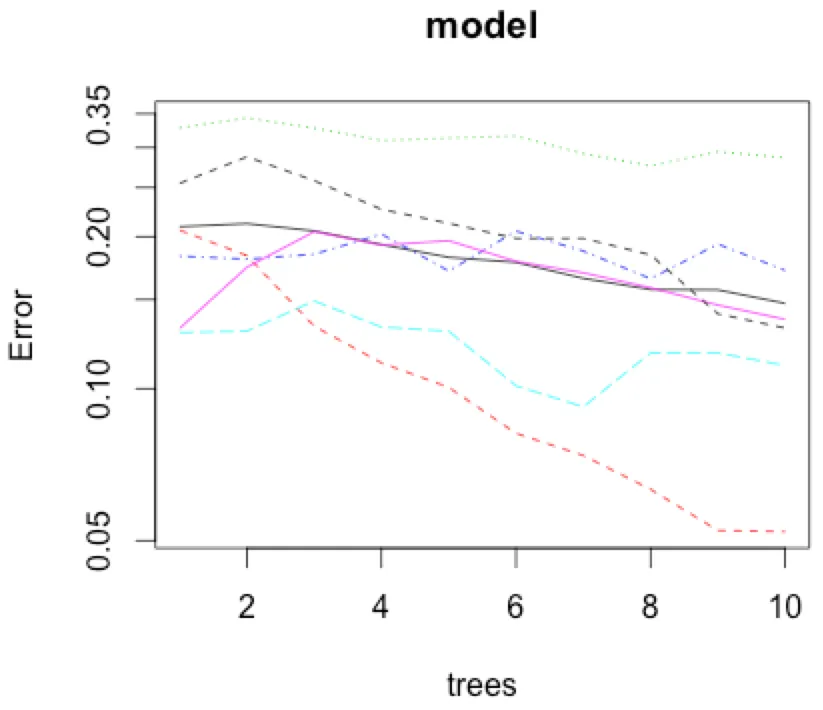 我的问题是如何在此添加图例,以便我可以看到分类中每个值所对应的颜色?因为分类变量是
data$classification。我无法弄清楚如何使用legend()函数来实现这一点。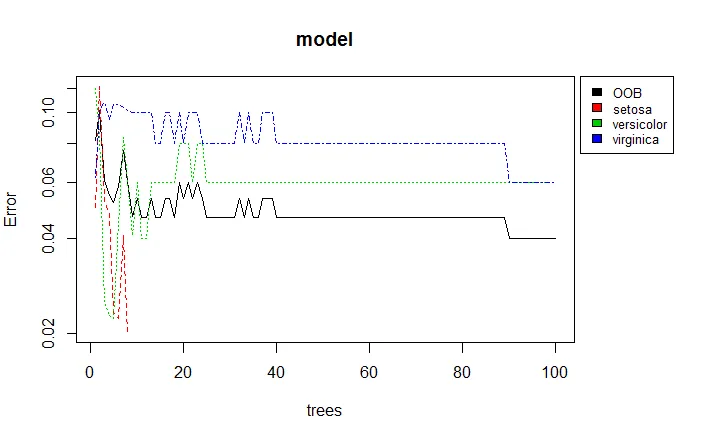
legend("topright", legend=unique(train$classification), col=unique(as.numeric(train$classification)), pch=19)- seawolfpar(mar=c(1,1))-> @EngrStudentpar(mar=c(1,1))- agstudy