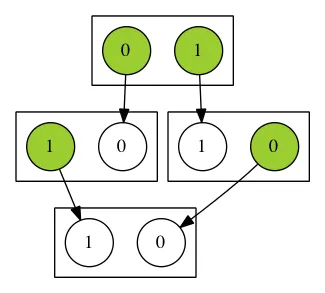
我有以下(简化的)图表,由以下.dot生成:
我希望能够在子图内强制排序,以便每个子图的节点按升序显示(每个簇都应该放置节点(0,1),而不是(1,0))。据我了解,rankdir是我第一个尝试的方式,但它不支持子图,那么有没有适当的方法来实现这一点呢?我正在寻找一种解决方案,可以给我一个相似的布局(然后包括更多交叉的箭头),并且可扩展性好,因为实际上的图形将会非常大。
digraph Configurations {

  subgraph cluster_1 {
    s_0_0 [shape=circle,style=filled,fixedsize=true,width=0.5,label="0",fillcolor=yellowgreen]
    s_0_1 [shape=circle,style=filled,fixedsize=true,width=0.5,label="1",fillcolor=yellowgreen]
  }
  subgraph cluster_2 {
    s_1_0 [shape=circle,style=filled,fixedsize=true,width=0.5,label="0",fillcolor=yellowgreen]
    s_1_1 [shape=circle,style=filled,fixedsize=true,width=0.5,label="1",fillcolor=white]
  }
  subgraph cluster_3 {
    s_2_0 [shape=circle,style=filled,fixedsize=true,width=0.5,label="0",fillcolor=white]
    s_2_1 [shape=circle,style=filled,fixedsize=true,width=0.5,label="1",fillcolor=yellowgreen]
  }
  subgraph cluster_4 {
    s_3_0 [shape=circle,style=filled,fixedsize=true,width=0.5,label="0",fillcolor=white]
    s_3_1 [shape=circle,style=filled,fixedsize=true,width=0.5,label="1",fillcolor=white]
  }

  s_0_1 -> s_1_1
  s_0_0 -> s_2_0
  s_2_1 -> s_3_1
  s_1_0 -> s_3_0
}
我希望能够在子图内强制排序,以便每个子图的节点按升序显示(每个簇都应该放置节点(0,1),而不是(1,0))。据我了解,rankdir是我第一个尝试的方式,但它不支持子图,那么有没有适当的方法来实现这一点呢?我正在寻找一种解决方案,可以给我一个相似的布局(然后包括更多交叉的箭头),并且可扩展性好,因为实际上的图形将会非常大。
remincross=false以防止发生这种情况。 - mwiegboldt