嵌套节点是不可能的,但嵌套簇是可能的。
子图/簇有一些预定义的样式。节点也有预定义的形状。我不知道在不同的layout(或者像将边框表示为一系列节点的替代方法)中手动编辑节点边框形状的路径,在graphviz中是否可以实现,也许有人能告诉我们。
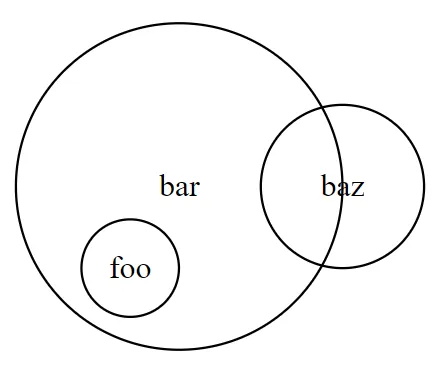
您可以在neato布局引擎中获得嵌套节点,但实际上它们只是视觉上嵌套,因为您只是使用pos属性设置它们的坐标,这意味着它们会重叠在一起。
示例图片:
和脚本:
graph {
    layout=neato

    node [shape=circle pin=true ]

    foo [height=0.6 pos="0.7,1.5" ]
    bar [height=2 pos="1,2" ]
    baz [height=1 pos="2,2" ]
}
你可以按照这个答案中的描述将图像导入到节点中作为背景。例如,对于Windows,你可以使用这个官方归档,它附带了一个cairo.dll,这将避免在运行命令$ dot -Tpng input.dot -o output.png时出现类似Warning: No loadimage plugin for "jpeg:cairo"的错误。
你问题中的图像可以像这样绘制:
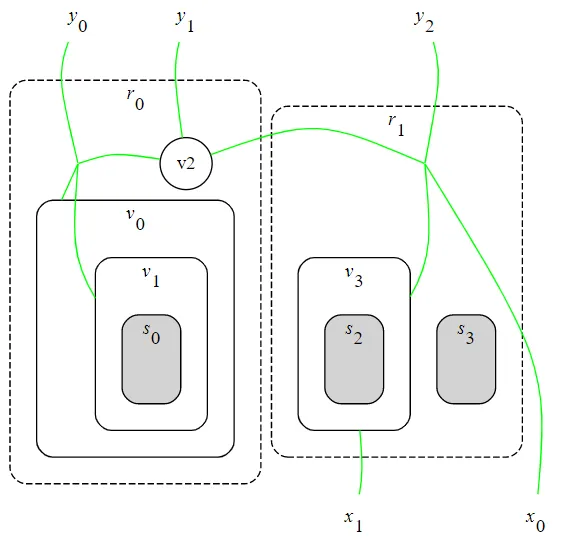
脚本:
digraph {
    graph [
        layout=dot,
        ranksep=1,
        overlap=false,
        compound=true, // to enable `lhead`, `ltail` features
        newrank=true, // to enable ranking between nodes in clusters
        splines=true,
        splines=curved]
    edge[color=lime arrowhead=none]
    node[shape=plaintext]

    y0 [label=<<FONT><I>y</I><SUB>0</SUB></FONT>>]
    y1 [label=<<FONT><I>y</I><SUB>1</SUB></FONT>>]
    y2 [label=<<FONT><I>y</I><SUB>2</SUB></FONT>>]
    x0 [label=<<FONT><I>x</I><SUB>0</SUB></FONT>>]
    x1 [label=<<FONT><I>x</I><SUB>1</SUB></FONT>>]

    subgraph cluster_r0{
        style="rounded, dashed"
        margin=20
        label=<<FONT><I>r</I><SUB>0</SUB></FONT>>
        v2 [shape=circle]
        noname_dot[shape=point height=0]

        subgraph cluster_v0{
            style="rounded"
            label=<<FONT><I>v</I><SUB>0</SUB></FONT>>
            invis_dot_1 [style=invis shape=point]

            subgraph cluster_v1{
                style="rounded";
                label=<<FONT><I>v</I><SUB>1</SUB></FONT>>

                subgraph cluster_s0{
                    label=<<FONT><I>s</I><SUB>0</SUB></FONT>>
                    fillcolor=lightgrey
                    style="filled, rounded"
                    invis_dot_2 [style=invis shape=point]
                }
            }
        }
    }

    y0 -> noname_dot
    noname_dot -> invis_dot_2 [lhead="cluster_v1"]
    noname_dot -> invis_dot_1 [lhead="cluster_v0"]
    noname_dot -> v2 [constraint=false]
    y1 -> v2

    subgraph cluster_r1{
        style="rounded, dashed"
        margin=20
        label=<<FONT><I>r</I><SUB>1</SUB></FONT>>
        noname_dot_2 [shape=point height=0]

        subgraph cluster_s3{
            label=<<FONT><I>s</I><SUB>3</SUB></FONT>>
            fillcolor=lightgrey
            style="filled, rounded"
            invis_dot_s3 [style=invis shape=point]
        }
        subgraph cluster_v3{
            style="rounded"
            label=<<FONT><I>v</I><SUB>3</SUB></FONT>>

            subgraph cluster_s2{
                label=<<FONT><I>s</I><SUB>2</SUB></FONT>>
                fillcolor=lightgrey
                style="filled, rounded"
                invis_dot_s2 [style=invis shape=point]
            }
        }
    }

    y2 -> noname_dot_2
    noname_dot_2 -> x0
    v2 -> noname_dot_2 [weight=0]
    noname_dot_2 -> invis_dot_s2 [lhead="cluster_v3"]
    invis_dot_s2 -> x1 [ltail="cluster_v3"]

    // Vertical alignment (`rank`) of the desired nodes:
    {rank=same; noname_dot; noname_dot_2; v2 }
    {rank=same; invis_dot_s3; invis_dot_s2 }
    {rank=same; x0; x1;}
    {rank=same; y0; y1; y2;}
}
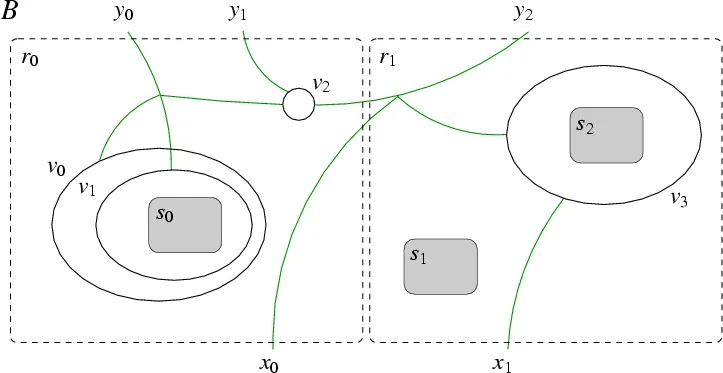 )。是否可以直接嵌套节点在GraphViz中?如果不行,是否可以更改子图/簇的形状?我发现一篇关于如何将图像导入到节点中的帖子,但那似乎比在PowerPoint中绘制它们还要麻烦。我也可以使集群可见,但它们将包括来自集群外部的节点,并且据我所知具有固定的形状。感谢您的帮助。