如何将pandas DataFrame表保存为png格式的图片

114
我构建了一个包含结果的Pandas数据帧。该数据帧充当表格。在创建数据帧时,每行代表一个名称,即index=['name1','name2',...],并且有多级索引列。我想显示这个表格并将其保存为png(或任何图形格式)。目前,我能做到的最接近的方法是将其转换为HTML,但我想要一个PNG格式的文件。似乎有类似的问题,例如如何将Pandas数据帧/系列数据保存为图像? 然而,标记的解决方案将数据框转换为折线图(而不是表格),另一种解决方案则依赖于PySide,我想要避开它,因为我无法在Linux上进行pip安装。我希望这段代码易于移植。用Python实现表格转PNG应该很容易。感谢所有帮助。

2
你可以做的一件事是将其导出为文本并保存为图像:https://dev59.com/6WMm5IYBdhLWcg3wHMJ0你也可以使用webkit2png将html转换为png:https://dev59.com/T2035IYBdhLWcg3wGL5T还有这个:https://dev59.com/2V8d5IYBdhLWcg3wkS3Y 和 https://dev59.com/Y2Af5IYBdhLWcg3wgy4Y - Charlie Haley
一个重复的问题:如何将 Pandas DataFrame / Series 数据保存为图像? - volodymyr
2
由于似乎没有针对这个问题的简单解决方案,因此快速的方法是从浏览器中简单地截取屏幕截图,例如在Firefox中 - ImportanceOfBeingErnest
Latex表格转换成PNG格式怎么样(不是Latex字符串)? - Charlie Parker
13个回答

106
Pandas允许您使用matplotlib绘制表格(详情请见这里)。通常情况下,这会将表格直接绘制到一个带有坐标轴和其他东西的图表上,而这不是您想要的。但是,可以先删除它们:
import matplotlib.pyplot as plt
import pandas as pd
from pandas.table.plotting import table # EDIT: see deprecation warnings below

ax = plt.subplot(111, frame_on=False) # no visible frame
ax.xaxis.set_visible(False)  # hide the x axis
ax.yaxis.set_visible(False)  # hide the y axis

table(ax, df)  # where df is your data frame

plt.savefig('mytable.png')

输出可能不是最美观的,但你可以在这里找到table()函数的其他参数。同时,感谢这篇文章提供了有关如何在matplotlib中删除坐标轴的信息。


编辑:

这里是一种(不得不说有些hacky)的方法,可以在使用上述方法绘图时模拟多索引。如果您有一个名为df的多索引数据帧,看起来像:

first  second
bar    one       1.991802
       two       0.403415
baz    one      -1.024986
       two      -0.522366
foo    one       0.350297
       two      -0.444106
qux    one      -0.472536
       two       0.999393
dtype: float64

首先重置索引,使它们成为普通列。

df = df.reset_index() 
df
    first second       0
0   bar    one  1.991802
1   bar    two  0.403415
2   baz    one -1.024986
3   baz    two -0.522366
4   foo    one  0.350297
5   foo    two -0.444106
6   qux    one -0.472536
7   qux    two  0.999393

通过将高阶多级索引列中的所有重复项设置为空字符串来删除它们(在我的示例中,我只有在“first”中存在重复索引):

df.ix[df.duplicated('first') , 'first'] = '' # see deprecation warnings below
df
  first second         0
0   bar    one  1.991802
1          two  0.403415
2   baz    one -1.024986
3          two -0.522366
4   foo    one  0.350297
5          two -0.444106
6   qux    one -0.472536
7          two  0.999393

将“索引”中的列名称更改为空字符串

new_cols = df.columns.values
new_cols[:2] = '',''  # since my index columns are the two left-most on the table
df.columns = new_cols 

现在调用表函数,但将表中所有行的标签设置为空字符串(这样确保您的绘图的实际索引不会显示):

table(ax, df, rowLabels=['']*df.shape[0], loc='center')

et voila:

enter image description here

这是一个不太好看但完全功能的多重索引表。

编辑:弃用警告

如评论中所指出,table的导入语句已过时:

from pandas.tools.plotting import table

现在已经被弃用,较新版本的pandas推荐使用:

from pandas.plotting import table 

编辑:弃用警告 2

ix索引器现已完全弃用,因此我们应该使用loc索引器进行替换:

df.ix[df.duplicated('first') , 'first'] = ''

使用
df.loc[df.duplicated('first') , 'first'] = ''

2
这让我更接近了解答案。不幸的是,我之前看到过类似的问题,但我刚意识到它没有起作用,因为我使用的是过时的pandas版本。这似乎很好地工作,除了两件事。1)表格的一部分似乎总是超出框架。我尝试了table(ax, df, loc='center'),这有所帮助,但左侧的索引被切成了一半。如果我使用plt.show(),只要窗口调整大小,这个问题就会得到解决。2)table似乎无法处理多级索引列。我的列显示为('A', '1'),('A', '2'),而不是'A'在顶部并跨越'1'和'2'的2行。 - Shatnerz
有关超出框架数据的帮助,请查看此处的建议(https://dev59.com/uWQm5IYBdhLWcg3w6ShR),特别是由@FrancescoMontesano回答中的“简单方法”。对于多索引问题,你可能会很遗憾。如果我找到了什么,我会告诉你的。 - bunji
1
为了解决我的第一个问题,plt.savefig('test.png', bbox_inches='tight') 是有效的。多级索引并不是什么大问题。我只是惊讶于没有人创建一种简单的方法将表格保存为图像。这让我觉得可能有更好的方法,但我完全没有意识到。我想在有时间的时候可以尝试为 pandas 编写一些东西。 - Shatnerz
@Shatners 我已经为你的多索引问题添加了一个可能的修复方法。它不是最漂亮的,但它能完成工作。 - bunji
4
我们应该注意到一个 FutureWarning,即 pandas.tools.plotting.table 被弃用了,请改为导入 pandas.plotting.table - Bowen Peng
显示剩余5条评论

88

实际上有一个叫做 dataframe_image 的 Python 库,只需要执行

pip install dataframe_image

导入必要的模块

import pandas as pd
import numpy as np
import dataframe_image as dfi
df = pd.DataFrame(np.random.randn(6, 6), columns=list('ABCDEF'))

如果您想要的话,可以通过以下方式为表格添加样式:

df_styled = df.style.background_gradient() #adding a gradient based on values in cell

最后:

dfi.export(df_styled,"mytable.png")

8
一个简单、优美的答案! - Woden
1
如果我在导出时添加table_conversion = 'matplotlib'选项,就可以正常工作,因为我在WSL中使用Chrome时遇到了问题。如果我删除matplotlib选项,我会得到以下错误,我需要在调用Chrome时添加no-sandbox选项,但我找不到任何文档说明如何添加它。无法移动到新名称空间:支持PID名称空间,支持网络名称空间,但失败:errno = Permission denied - GurhanCagin
2
一张图片展示它的外观会更有帮助。 - user3521099
16
“OSError: 在您的计算机上找不到Chrome可执行文件。” 嗯...我不确定我是否想在我的upyter计算实例上安装Chrome。 - Att Righ
1
完美,谢谢,但如何更改导出的质量...? - Xomuama
显示剩余5条评论

38

解决您的问题最好的方法可能是先将您的数据框导出为HTML,然后使用HTML-to-image工具进行转换。

最终的外观可以通过CSS进行微调。

流行的HTML-to-image渲染选项包括:


假设我们有一个名为df的数据框。我们可以使用以下代码生成它:
import string
import numpy as np
import pandas as pd


np.random.seed(0)  # just to get reproducible results from `np.random`
rows, cols = 5, 10
labels = list(string.ascii_uppercase[:cols])
df = pd.DataFrame(np.random.randint(0, 100, size=(5, 10)), columns=labels)
print(df)
#     A   B   C   D   E   F   G   H   I   J
# 0  44  47  64  67  67   9  83  21  36  87
# 1  70  88  88  12  58  65  39  87  46  88
# 2  81  37  25  77  72   9  20  80  69  79
# 3  47  64  82  99  88  49  29  19  19  14
# 4  39  32  65   9  57  32  31  74  23  35

使用WeasyPrint

这种方法使用一个可通过pip安装的软件包,使您可以在Python生态系统中完成所有操作。 weasyprint的一个缺点是似乎没有提供一种适应图像大小的方法(调整图像大小以适应其内容)。 无论如何,在Python / PIL中删除图像的某些背景相对较容易,并且在下面的trim()函数中实现(从此处改编而来)。 还需要确保图像足够大,这可以通过CSS的@page size属性来实现。

以下是代码:

import weasyprint as wsp
import PIL as pil


def trim(source_filepath, target_filepath=None, background=None):
    if not target_filepath:
        target_filepath = source_filepath
    img = pil.Image.open(source_filepath)
    if background is None:
        background = img.getpixel((0, 0))
    border = pil.Image.new(img.mode, img.size, background)
    diff = pil.ImageChops.difference(img, border)
    bbox = diff.getbbox()
    img = img.crop(bbox) if bbox else img
    img.save(target_filepath)


img_filepath = 'table1.png'
css = wsp.CSS(string='''
@page { size: 2048px 2048px; padding: 0px; margin: 0px; }
table, td, tr, th { border: 1px solid black; }
td, th { padding: 4px 8px; }
''')
html = wsp.HTML(string=df.to_html())
html.write_png(img_filepath, stylesheets=[css])
trim(img_filepath)

table_weasyprint


使用 wkhtmltopdf/wkhtmltoimage

这种方法使用了一个外部的开源工具,需要在生成图像之前安装。也有一个Python包pdfkit,它作为其前端(但仍需要自己安装核心软件),但我不会使用它。

wkhtmltoimage可以通过subprocess(或任何其他类似于Python中运行外部程序的方式)简单地调用。同时还需要将HTML文件输出到磁盘上。

代码如下:

import subprocess


df.to_html('table2.html')
subprocess.call(
    'wkhtmltoimage -f png --width 0 table2.html table2.png', shell=True)

table_wkhtmltoimage

同时,它的外观可以通过CSS进行进一步调整,类似于其他方法。


25

虽然我不确定这是否是您期望的结果,但您可以使用Seaborn Heatmap并带注释绘制DataFrame来将DataFrame保存为png,像这样:

http://stanford.edu/~mwaskom/software/seaborn/generated/seaborn.heatmap.html#seaborn.heatmap

带注释的Seaborn heatmap示例

它可以直接处理Pandas Dataframe。您可以查看此示例:Efficiently ploting a table in csv format using Python

您可能需要更改颜色映射以仅显示白色背景。

希望这有所帮助。

编辑: 以下是可执行此操作的代码片段:

import matplotlib
import seaborn as sns

def save_df_as_image(df, path):
    # Set background to white
    norm = matplotlib.colors.Normalize(-1,1)
    colors = [[norm(-1.0), "white"],
            [norm( 1.0), "white"]]
    cmap = matplotlib.colors.LinearSegmentedColormap.from_list("", colors)
    # Make plot
    plot = sns.heatmap(df, annot=True, cmap=cmap, cbar=False)
    fig = plot.get_figure()
    fig.savefig(path)

1
我需要阅读那些链接,但我不想绘制数据。我只想要表格的图像,就像你使用df.to_html()时所看到的那样。一些列包含名称和类似的字符串。 - Shatnerz
不错的建议——我在思考这个问题时忘记了热力图。 - zthomas.nc

12
@bunji 的解决方案对我有帮助,但默认选项并不总是给出好的结果。我添加了一些有用的参数来微调表格的外观。
import pandas as pd
import matplotlib.pyplot as plt
from pandas.plotting import table
import numpy as np

dates = pd.date_range('20130101',periods=6)
df = pd.DataFrame(np.random.randn(6,4),index=dates,columns=list('ABCD'))

df.index = [item.strftime('%Y-%m-%d') for item in df.index] # Format date

fig, ax = plt.subplots(figsize=(12, 2)) # set size frame
ax.xaxis.set_visible(False)  # hide the x axis
ax.yaxis.set_visible(False)  # hide the y axis
ax.set_frame_on(False)  # no visible frame, uncomment if size is ok
tabla = table(ax, df, loc='upper right', colWidths=[0.17]*len(df.columns))  # where df is your data frame
tabla.auto_set_font_size(False) # Activate set fontsize manually
tabla.set_fontsize(12) # if ++fontsize is necessary ++colWidths
tabla.scale(1.2, 1.2) # change size table
plt.savefig('table.png', transparent=True)
结果: 表格

你好!我该如何将某一列的数值四舍五入? - plnnvkv

10

我在做一个项目时也有同样的需求,但是所有的答案都不能满足我的要求。最终我找到了一个方法,也许对这个情况有用:

from bokeh.io import export_png, export_svgs
from bokeh.models import ColumnDataSource, DataTable, TableColumn

def save_df_as_image(df, path):
    source = ColumnDataSource(df)
    df_columns = [df.index.name]
    df_columns.extend(df.columns.values)
    columns_for_table=[]
    for column in df_columns:
        columns_for_table.append(TableColumn(field=column, title=column))

    data_table = DataTable(source=source, columns=columns_for_table,height_policy="auto",width_policy="auto",index_position=None)
    export_png(data_table, filename = path)

enter image description here


这将会产生比其他答案更漂亮的表格。 - B.Kocis
同意@B.Kocis。谢谢。 - bamdan
1
bokeh.io有很多依赖项,包括一个Web浏览器,如果我们想将其导出为图像,我不建议使用此解决方案。 - Nicole Finnie

9

有一个名为df2img的Python库,可以在https://pypi.org/project/df2img/上获取(免责声明:我是作者)。它是使用plotly作为后端的包装器/便捷函数。

您可以在https://df2img.dev找到文档。

import pandas as pd

import df2img

df = pd.DataFrame(
    data=dict(
        float_col=[1.4, float("NaN"), 250, 24.65],
        str_col=("string1", "string2", float("NaN"), "string4"),
    ),
    index=["row1", "row2", "row3", "row4"],
)

pd.DataFrame保存为.png文件可以很快地完成。您可以应用格式,如背景颜色或交替行颜色以提高可读性。

fig = df2img.plot_dataframe(
    df,
    title=dict(
        font_color="darkred",
        font_family="Times New Roman",
        font_size=16,
        text="This is a title",
    ),
    tbl_header=dict(
        align="right",
        fill_color="blue",
        font_color="white",
        font_size=10,
        line_color="darkslategray",
    ),
    tbl_cells=dict(
        align="right",
        line_color="darkslategray",
    ),
    row_fill_color=("#ffffff", "#d7d8d6"),
    fig_size=(300, 160),
)

df2img.save_dataframe(fig=fig, filename="plot.png")

pd.DataFrame png file


4
使用Anaconda Spyder IDE将Pandas数据框快速转换成png图像的最简单和最快的方法 - 只需在变量资源管理器中双击数据框,IDE表格将出现,具有自动格式和颜色方案。只需使用截图工具捕获表格,以png格式保存后可用于报告中:

2020 Blue Chip Ratio

这为我节省了大量时间,同时仍然优雅且专业。


4
如果您在编程环境中调用DataFrame时,对其格式感到满意,那么最简单的方法就是使用打印屏幕并使用基本图像编辑软件裁剪图像。这里是我使用Jupyter Notebook和Pinta Image Editor(Ubuntu免费软件)得到的效果。

这是最优雅的解决方案。样式化的表格看起来非常漂亮,而to_html()解决方案虽然非常简单,但无法保持样式。 - June Skeeter
1
这很难自动化,尤其是其中很多部分。 - baxx

3
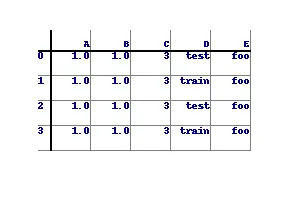
以下内容需要大量自定义才能正确格式化表格,但它的基本结构是可以工作的:
import numpy as np
from PIL import Image, ImageDraw, ImageFont
import pandas as pd

df = pd.DataFrame({ 'A' : 1.,
                     'B' : pd.Series(1,index=list(range(4)),dtype='float32'),
                     'C' : np.array([3] * 4,dtype='int32'),
                     'D' : pd.Categorical(["test","train","test","train"]),
                     'E' : 'foo' })


class DrawTable():
    def __init__(self,_df):
        self.rows,self.cols = _df.shape
        img_size = (300,200)
        self.border = 50
        self.bg_col = (255,255,255)
        self.div_w = 1
        self.div_col = (128,128,128)
        self.head_w = 2
        self.head_col = (0,0,0)
        self.image = Image.new("RGBA", img_size,self.bg_col)
        self.draw = ImageDraw.Draw(self.image)
        self.draw_grid()
        self.populate(_df)
        self.image.show()
    def draw_grid(self):
        width,height = self.image.size
        row_step = (height-self.border*2)/(self.rows)
        col_step = (width-self.border*2)/(self.cols)
        for row in range(1,self.rows+1):
            self.draw.line((self.border-row_step//2,self.border+row_step*row,width-self.border,self.border+row_step*row),fill=self.div_col,width=self.div_w)
            for col in range(1,self.cols+1):
                self.draw.line((self.border+col_step*col,self.border-col_step//2,self.border+col_step*col,height-self.border),fill=self.div_col,width=self.div_w)
        self.draw.line((self.border-row_step//2,self.border,width-self.border,self.border),fill=self.head_col,width=self.head_w)
        self.draw.line((self.border,self.border-col_step//2,self.border,height-self.border),fill=self.head_col,width=self.head_w)
        self.row_step = row_step
        self.col_step = col_step
    def populate(self,_df2):
        font = ImageFont.load_default().font
        for row in range(self.rows):
            print(_df2.iloc[row,0])
            self.draw.text((self.border-self.row_step//2,self.border+self.row_step*row),str(_df2.index[row]),font=font,fill=(0,0,128))
            for col in range(self.cols):
                text = str(_df2.iloc[row,col])
                text_w, text_h = font.getsize(text)
                x_pos = self.border+self.col_step*(col+1)-text_w
                y_pos = self.border+self.row_step*row
                self.draw.text((x_pos,y_pos),text,font=font,fill=(0,0,128))
        for col in range(self.cols):
            text = str(_df2.columns[col])
            text_w, text_h = font.getsize(text)
            x_pos = self.border+self.col_step*(col+1)-text_w
            y_pos = self.border - self.row_step//2
            self.draw.text((x_pos,y_pos),text,font=font,fill=(0,0,128))
    def save(self,filename):
        try:
            self.image.save(filename,mode='RGBA')
            print(filename," Saved.")
        except:
            print("Error saving:",filename)


table1 = DrawTable(df)
table1.save('C:/Users/user/Pictures/table1.png')
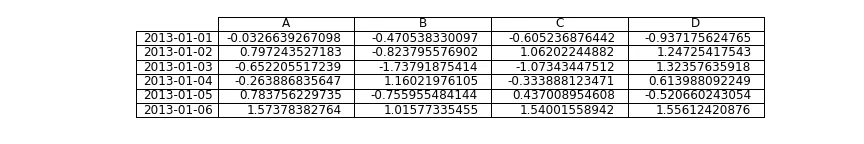
输出结果如下图所示:

enter image description here


网页内容由stack overflow 提供, 点击上面的
可以查看英文原文,
原文链接