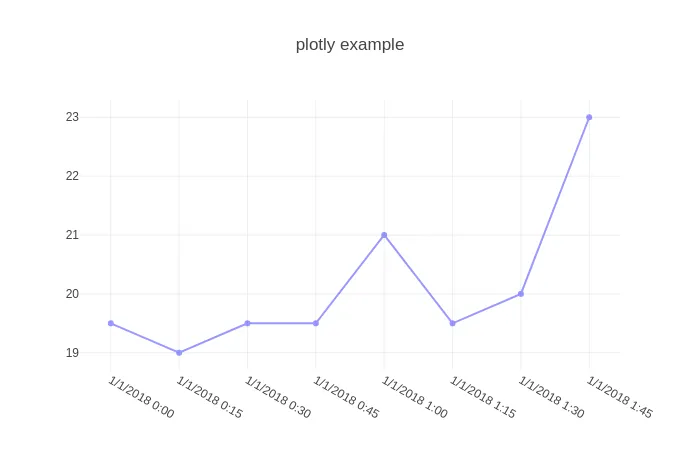
我有一组时间序列数据如下:
Datum   Menge
1/1/2018 0:00   19.5
1/1/2018 0:15   19.0
1/1/2018 0:30   19.5
1/1/2018 0:45   19.5
1/1/2018 1:00   21.0
1/1/2018 1:15   19.5
1/1/2018 1:30   20.0
1/1/2018 1:45   23.0
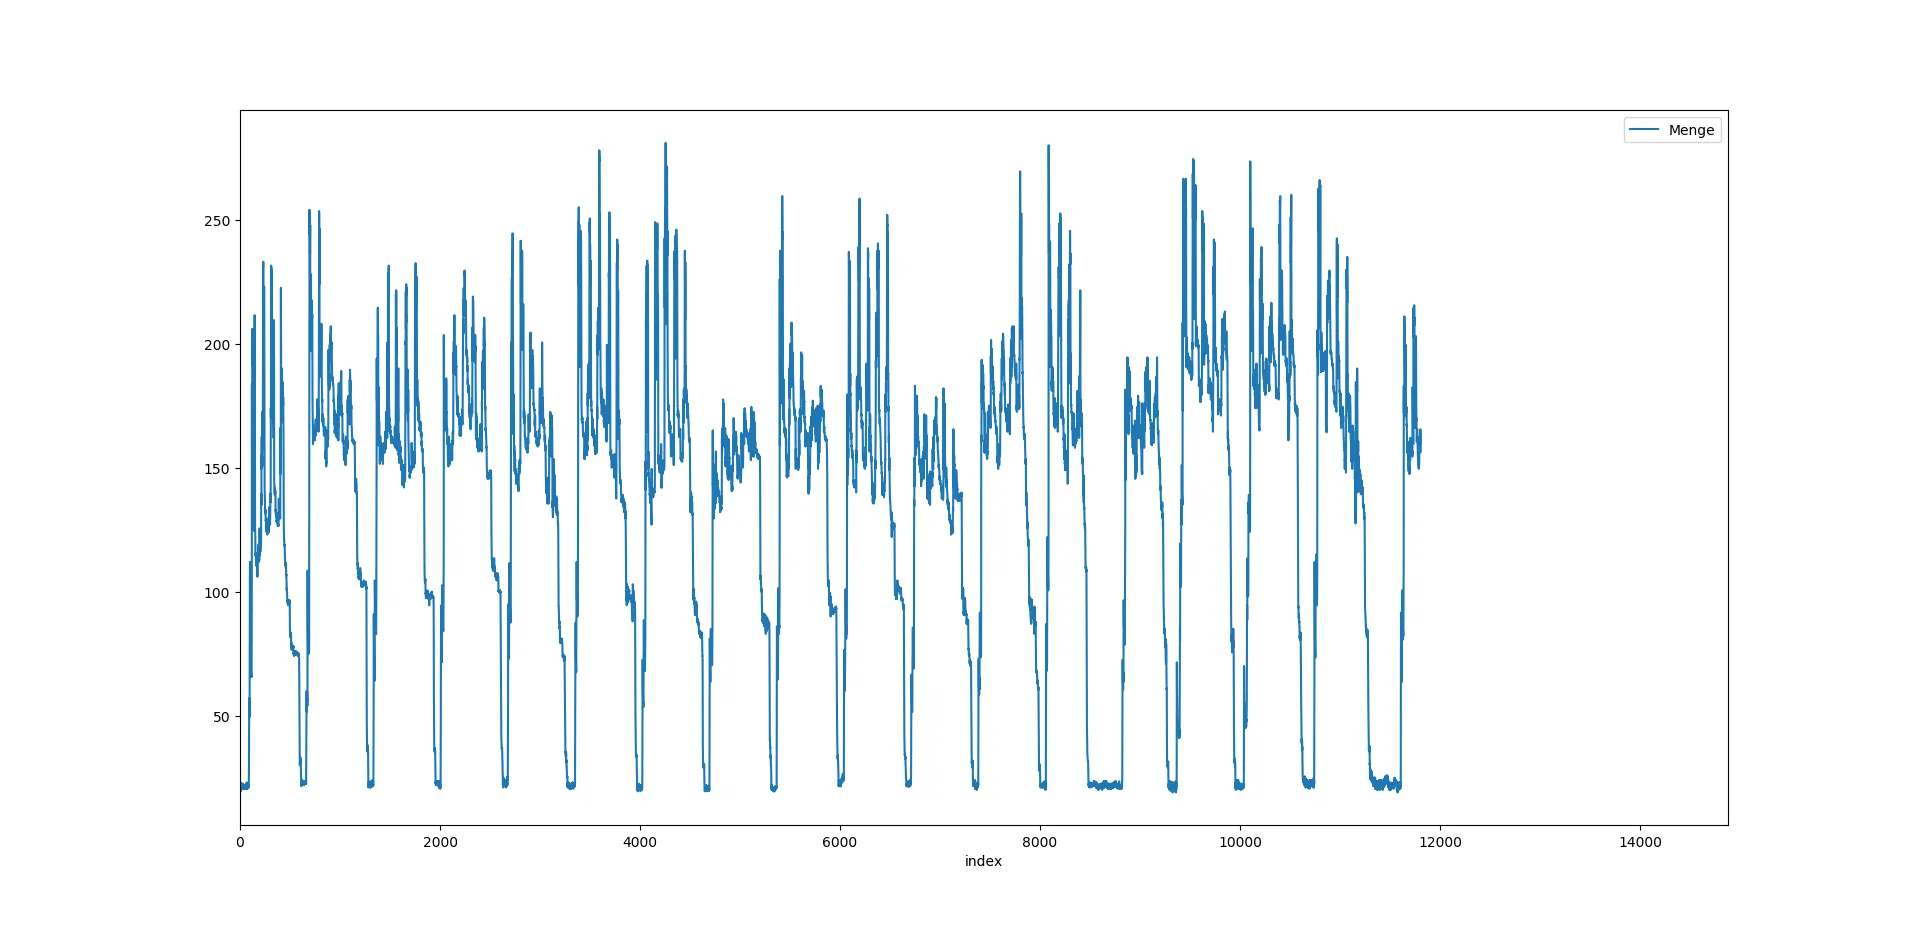
数据框 data 的形状为 (14880,2)。在 Menge 列中,只有 11807 个值是可用的,其余是 nan
我正在尝试按照以下方式绘制它:
data.plot()
plt.show()
这给了我
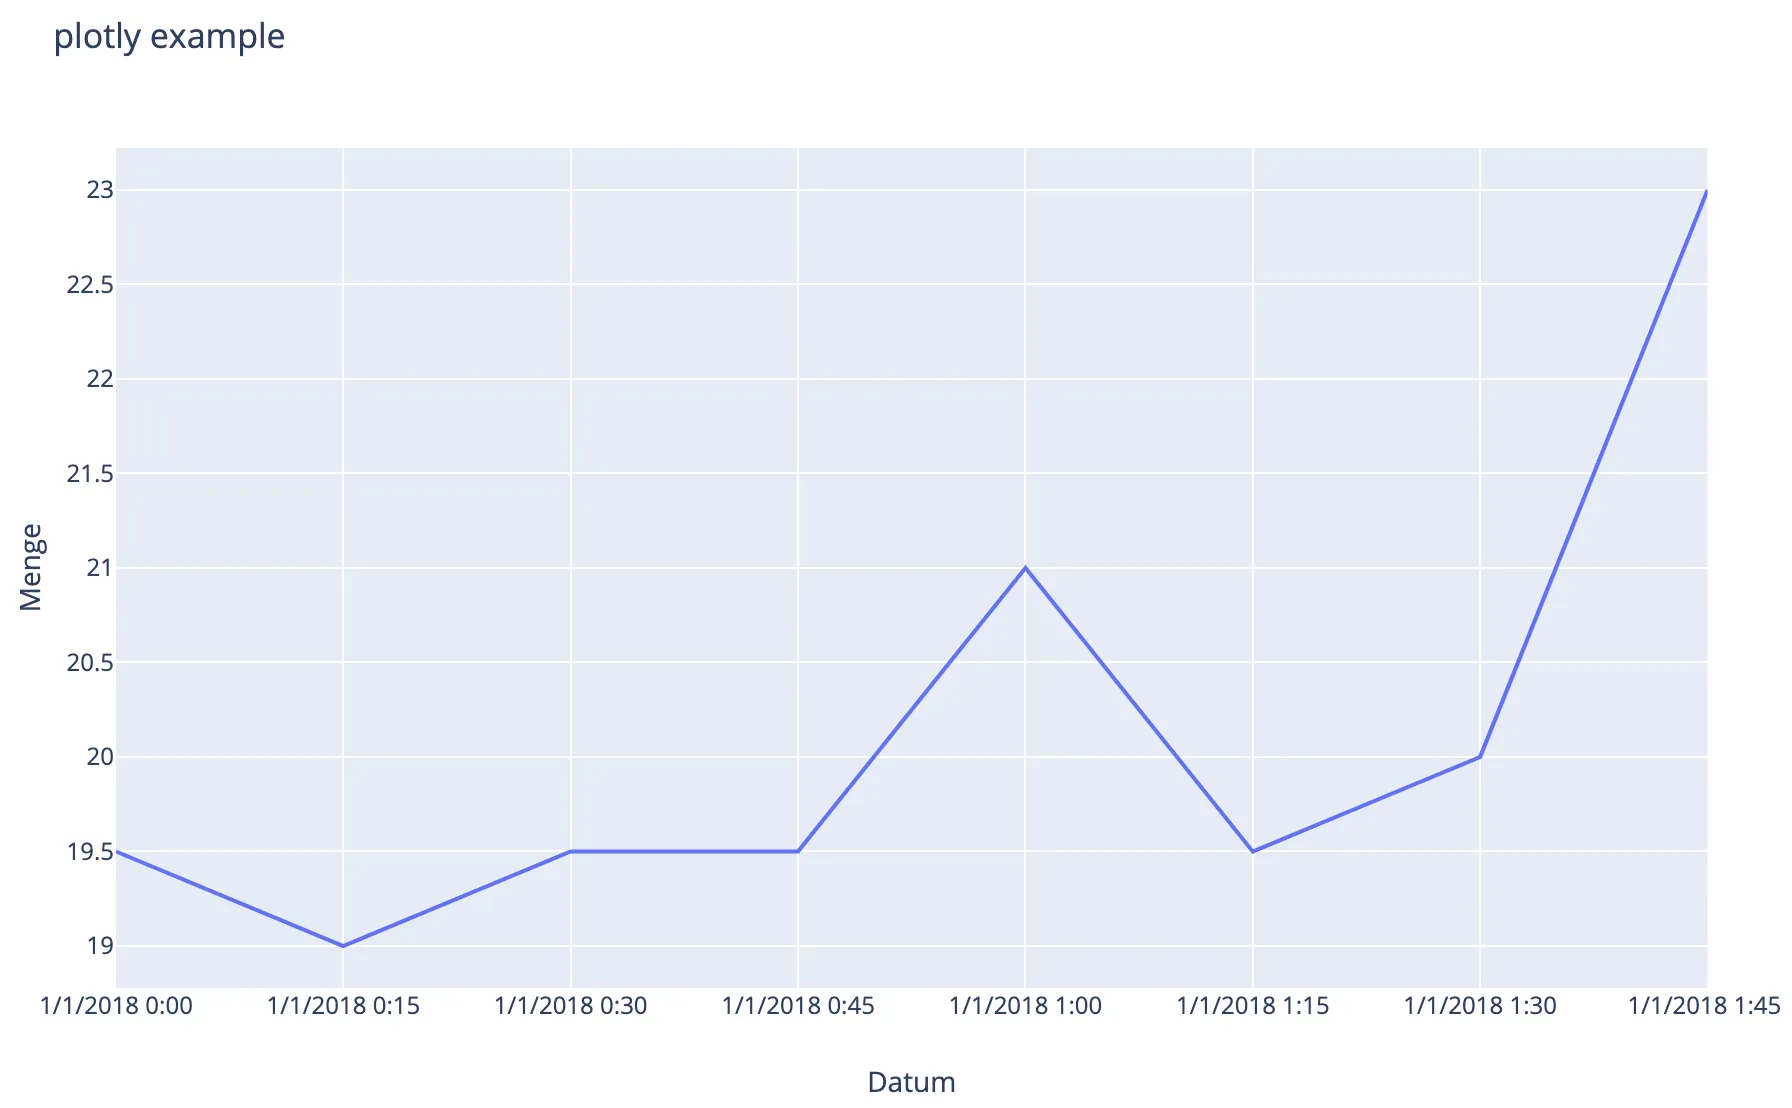
但我想使用 seaborn 或 plotly 来绘制相同的图形
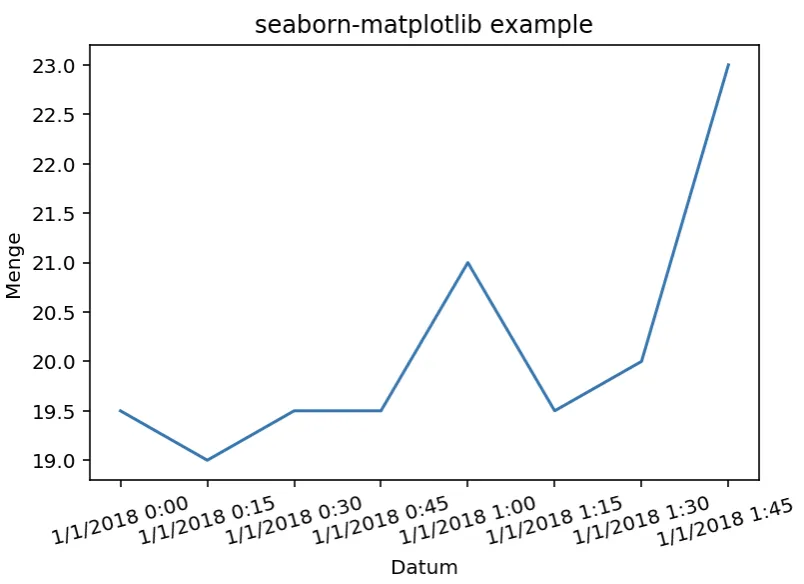
对于 seaborn,我尝试过:
x = data.Datum
y = data.Menge.values
sns.lineplot(x = x, y = y, data = data)
然后它会输出:
Out[3]: <matplotlib.axes._subplots.AxesSubplot at 0x21286bb8668>
一个新的图形窗口被打开,但是它显示图1(未响应)
所以,我有两个问题:
- 在上面的图中,我们可以看到x轴有索引,但我想让它成为那里的
Datum值。如何更改? - 我想在seaborn或plotly中实现这一点,是否有办法在其中实现所有这些?
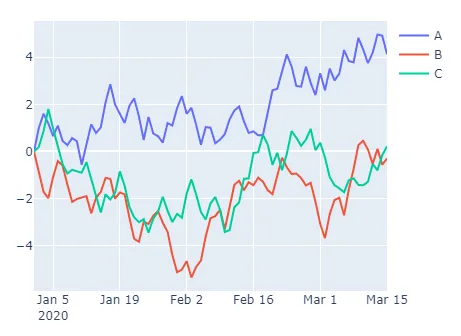
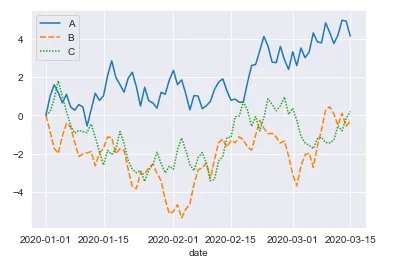

sns.lineplot(x='Datum', y='Menge', data=data)对我有效。这些列的数据类型是什么? - m13op22输出[3]: 日期 对象 数量 浮点数 dtype: 对象- some_programmercufflinks与 plotly 一起使用。 - Ben