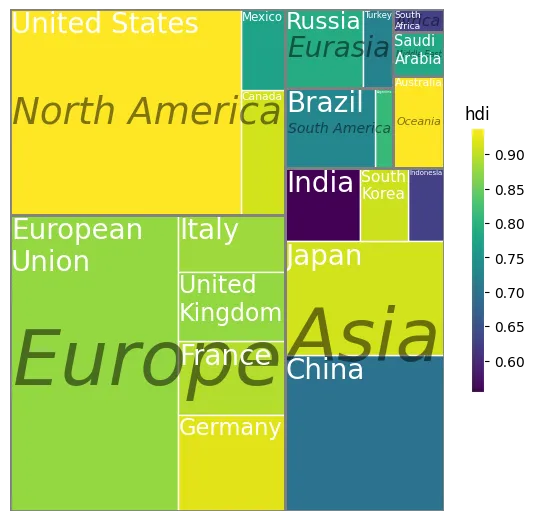
包matplotlib-extra提供了一个支持多级树状图绘制的treemap函数。对于G20数据集,treemap可以生成类似的树状图,例如:
import matplotlib.pyplot as plt
import mpl_extra.treemap as tr

fig, ax = plt.subplots(figsize=(7,7), dpi=100, subplot_kw=dict(aspect=1.156))

trc = tr.treemap(ax, df, area='gdp_mil_usd', fill='hdi', labels='country',
           levels=['region', 'country'],
           textprops={'c':'w', 'wrap':True,
                      'place':'top left', 'max_fontsize':20},
           rectprops={'ec':'w'},
           subgroup_rectprops={'region':{'ec':'grey', 'lw':2, 'fill':False,
                                         'zorder':5}},
           subgroup_textprops={'region':{'c':'k', 'alpha':0.5, 'fontstyle':'italic'}},
           )

ax.axis('off')

cb = fig.colorbar(trc.mappable, ax=ax, shrink=0.5)

cb.ax.set_title('hdi')
cb.outline.set_edgecolor('w')

plt.show()
获取到的树状图如下:
如需更多信息,您可以查看项目,其中有一些示例。源代码中包含API文档字符串。
 它是用 R
它是用 R