请看这张图片,我需要将柱状图和折线图的数据进行比较:
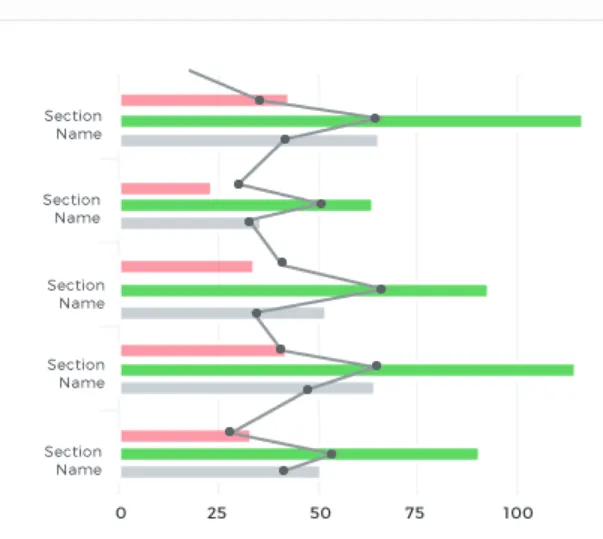
请问在Google组合图表中是否可以实现?
请看这张图片,我需要将柱状图和折线图的数据进行比较:
请问在Google组合图表中是否可以实现?
当然可以,看下面的例子...
google.charts.load('current', {
  callback: function () {
    var data = google.visualization.arrayToDataTable([
      ['Month', 'Bolivia', 'Ecuador', 'Madagascar', 'Papua New Guinea', 'Rwanda', 'Average'],
      ['2004/05',  165,      938,         522,             998,           450,      614.6],
      ['2005/06',  135,      1120,        599,             1268,          288,      682],
      ['2006/07',  157,      1167,        587,             807,           397,      623],
      ['2007/08',  139,      1110,        615,             968,           215,      609.4],
      ['2008/09',  136,      691,         629,             1026,          366,      569.6]
    ]);

    var chart = new google.visualization.ComboChart(document.getElementById('chart_div'));
    chart.draw(data, {
      title : 'Monthly Coffee Production by Country',
      vAxis: {title: 'Cups'},
      hAxis: {title: 'Month'},
      height: 420,
      orientation: 'vertical',
      seriesType: 'bars',
      series: {
        5: {
          pointSize: 5,
          type: 'line'
        }
      }
    });
  },
  packages: ['corechart']
});<script src="https://www.gstatic.com/charts/loader.js"></script>
<div id="chart_div"></div>Google Charts API 提供了一个 JavaScript 包装器,允许您自定义组合图表。它有很多的配置选项,您可以在此处查看Google Combo Chart Config options。您可以使用注释选项来构建跨越您的条形图的线条。要获取完整的组合图表文档,请访问https://developers.google.com/chart/interactive/docs/gallery/combochart