将scikit learn输出的metrics.classification_report转换为CSV或制表符分隔格式

53

我正在使用Scikit-Learn进行多类文本分类。该数据集使用多项式朴素贝叶斯分类器进行训练,具有数百个标签。以下是适用于拟合MNB模型的Scikit Learn脚本的摘录。

from __future__ import print_function

# Read **`file.csv`** into a pandas DataFrame

import pandas as pd
path = 'data/file.csv'
merged = pd.read_csv(path, error_bad_lines=False, low_memory=False)

# define X and y using the original DataFrame
X = merged.text
y = merged.grid

# split X and y into training and testing sets;
from sklearn.cross_validation import train_test_split
X_train, X_test, y_train, y_test = train_test_split(X, y, random_state=1)

# import and instantiate CountVectorizer
from sklearn.feature_extraction.text import CountVectorizer
vect = CountVectorizer()

# create document-term matrices using CountVectorizer
X_train_dtm = vect.fit_transform(X_train)
X_test_dtm = vect.transform(X_test)

# import and instantiate MultinomialNB
from sklearn.naive_bayes import MultinomialNB
nb = MultinomialNB()

# fit a Multinomial Naive Bayes model
nb.fit(X_train_dtm, y_train)

# make class predictions
y_pred_class = nb.predict(X_test_dtm)

# generate classification report
from sklearn import metrics
print(metrics.classification_report(y_test, y_pred_class))

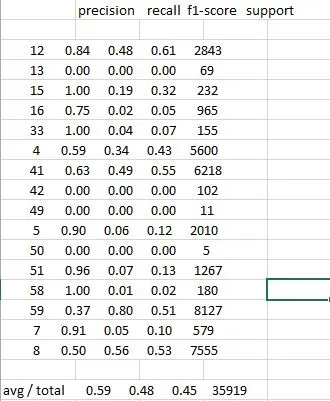
在命令行屏幕上,metrics.classification_report 的简化输出如下所示:

             precision  recall   f1-score   support
     12       0.84      0.48      0.61      2843
     13       0.00      0.00      0.00        69
     15       1.00      0.19      0.32       232
     16       0.75      0.02      0.05       965
     33       1.00      0.04      0.07       155
      4       0.59      0.34      0.43      5600
     41       0.63      0.49      0.55      6218
     42       0.00      0.00      0.00       102
     49       0.00      0.00      0.00        11
      5       0.90      0.06      0.12      2010
     50       0.00      0.00      0.00         5
     51       0.96      0.07      0.13      1267
     58       1.00      0.01      0.02       180
     59       0.37      0.80      0.51      8127
      7       0.91      0.05      0.10       579
      8       0.50      0.56      0.53      7555      
    avg/total 0.59      0.48      0.45     35919

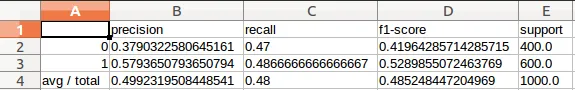
我想知道是否有任何方法可以将报告输出到一个带有常规列标题的标准csv文件中。

当我将命令行输出发送到csv文件中或尝试将屏幕输出复制/粘贴到电子表格-Openoffice Calc或Excel中时,它会将结果合并为一列。看起来像这样:

输入图像描述


1
我会在打字的同时尝试重新创建结果,但是您尝试过使用 Pandas 将表格转换为 DataFrame,然后使用“dataframe_name_here.to_csv()”将数据框发送到 csv 吗?您能否展示一下编写结果到 csv 的代码? - MattR
1
@MattR 我已经编辑了问题并提供了完整的Python代码...我是通过Linux命令行将脚本的输出传递到CSV文件中的,如下所示:$ python3 script.py > result.csv - Seun AJAO
19个回答

125
从scikit-learn v0.20开始,将分类报告转换为pandas数据框的最简单方法是将报告作为字典返回。
report = classification_report(y_test, y_pred, output_dict=True)

然后构建一个Dataframe并对其进行转置:

df = pandas.DataFrame(report).transpose()

从这里开始,您可以自由使用标准的pandas方法生成所需的输出格式(CSV、HTML、LaTeX等)。

请参阅文档


8
df.to_csv('file_name.csv') 对于懒惰的人 :) (翻译:将数据框保存为CSV格式文件,文件名为'file_name.csv'。这是一个方便懒惰人的方法 :)) - Prashant Saraswat
1
完美的答案。小提示:由于输出字典准确度只有一个值,它将在数据框的准确度行中重复出现。如果您希望导出与sklearn输出完全相同的结果,则可以使用以下代码片段。report.update({"accuracy": {"precision": None, "recall": None, "f1-score": report["accuracy"], "support": report['macro avg']['support']}}) - piedpiper
这个答案应该被接受! - Say OL

21

如果您想要个别分数,这应该可以很好地完成工作。

import pandas as pd

def classification_report_csv(report):
    report_data = []
    lines = report.split('\n')
    for line in lines[2:-3]:
        row = {}
        row_data = line.split('      ')
        row['class'] = row_data[0]
        row['precision'] = float(row_data[1])
        row['recall'] = float(row_data[2])
        row['f1_score'] = float(row_data[3])
        row['support'] = float(row_data[4])
        report_data.append(row)
    dataframe = pd.DataFrame.from_dict(report_data)
    dataframe.to_csv('classification_report.csv', index = False)

report = classification_report(y_true, y_pred)
classification_report_csv(report)

4
row ['precision'] = float(row_data [1]) ValueError:无法将字符串转换为浮点数: - user3806649
3
请将以下这行代码进行翻译: row_data = line.split(' ') 改为row_data = list(filter(None, row_data))``` 将这行代码“change line”转换为Python代码时,原先的代码是将变量line按照多个空格进行分割,然后将结果存储在row_data中。修改后的代码将使用单个空格作为分隔符进行分割,并使用filter函数过滤掉其中的空字符串,最终将结果存储在row_data中。 - RomaneG
非常酷,谢谢!我对split语句发表一下评论:row_data = line.split(' '),这个应该改成:row_data = line.split(),因为有时报告字符串中的空格数量不相等。 - Ting Jia
最好用row_data = ' '.join(line.split()) row_data = row_data.split(' ')替换row_data = line.split(' ')以应对不规则空格。 - Satheesh K

14

只需import pandas as pd,并确保设置默认为Falseoutput_dict参数,在计算classification_report时将其设置为True。这将导致生成一个classification_report字典,您可以将其传递给pandas DataFrame方法。您可能需要transpose结果DataFrame以适合所需的输出格式。然后,可以按照您的意愿将结果DataFrame写入csv文件。

clsf_report = pd.DataFrame(classification_report(y_true = your_y_true, y_pred = your_y_preds5, output_dict=True)).transpose()
clsf_report.to_csv('Your Classification Report Name.csv', index= True)

10

我们可以从precision_recall_fscore_support函数中获取实际值,然后将它们放入数据框中。 下面的代码将给出相同的结果,但现在是在pandas数据框中:

clf_rep = metrics.precision_recall_fscore_support(true, pred)
out_dict = {
             "precision" :clf_rep[0].round(2)
            ,"recall" : clf_rep[1].round(2)
            ,"f1-score" : clf_rep[2].round(2)
            ,"support" : clf_rep[3]
            }
out_df = pd.DataFrame(out_dict, index = nb.classes_)
avg_tot = (out_df.apply(lambda x: round(x.mean(), 2) if x.name!="support" else  round(x.sum(), 2)).to_frame().T)
avg_tot.index = ["avg/total"]
out_df = out_df.append(avg_tot)
print out_df

6
很明显,将分类报告输出为字典格式更好:
sklearn.metrics.classification_report(y_true, y_pred, output_dict=True)

这里有一个我写的函数,可以将所有类别(仅限类别)的结果转换为 pandas 数据帧。

def report_to_df(report):
    report = [x.split(' ') for x in report.split('\n')]
    header = ['Class Name']+[x for x in report[0] if x!='']
    values = []
    for row in report[1:-5]:
        row = [value for value in row if value!='']
        if row!=[]:
            values.append(row)
    df = pd.DataFrame(data = values, columns = header)
    return df

6

虽然之前的答案可能都能用,但我觉得它们有点啰嗦。下面的方法将每个类别的结果以及总结行存储在一个数据框中。虽然不太敏感于报告中的变化,但对我来说很管用。

#init snippet and fake data
from io import StringIO
import re
import pandas as pd
from sklearn import metrics
true_label = [1,1,2,2,3,3]
pred_label = [1,2,2,3,3,1]

def report_to_df(report):
    report = re.sub(r" +", " ", report).replace("avg / total", "avg/total").replace("\n ", "\n")
    report_df = pd.read_csv(StringIO("Classes" + report), sep=' ', index_col=0)        
    return(report_df)

#txt report to df
report = metrics.classification_report(true_label, pred_label)
report_df = report_to_df(report)

#store, print, copy...
print (report_df)

这将产生所需的输出:

Classes precision   recall  f1-score    support
1   0.5 0.5 0.5 2
2   0.5 0.5 0.5 2
3   0.5 0.5 0.5 2
avg/total   0.5 0.5 0.5 6

4

正如这里的一篇文章中提到的那样,precision_recall_fscore_support类似于classification_report

然后只需要使用Pandas以列格式轻松格式化数据,类似于classification_report所做的操作。以下是一个示例:

import numpy as np
import pandas as pd

from sklearn.metrics import classification_report
from  sklearn.metrics import precision_recall_fscore_support

np.random.seed(0)

y_true = np.array([0]*400 + [1]*600)
y_pred = np.random.randint(2, size=1000)

def pandas_classification_report(y_true, y_pred):
    metrics_summary = precision_recall_fscore_support(
            y_true=y_true, 
            y_pred=y_pred)
    
    avg = list(precision_recall_fscore_support(
            y_true=y_true, 
            y_pred=y_pred,
            average='weighted'))

    metrics_sum_index = ['precision', 'recall', 'f1-score', 'support']
    class_report_df = pd.DataFrame(
        list(metrics_summary),
        index=metrics_sum_index)
    
    support = class_report_df.loc['support']
    total = support.sum() 
    avg[-1] = total
    
    class_report_df['avg / total'] = avg

    return class_report_df.T

使用 classification_report 会得到如下结果:
print(classification_report(y_true=y_true, y_pred=y_pred, digits=6))

输出:

             precision    recall  f1-score   support

          0   0.379032  0.470000  0.419643       400
          1   0.579365  0.486667  0.528986       600

avg / total   0.499232  0.480000  0.485248      1000

然后使用我们的自定义函数 pandas_classification_report
df_class_report = pandas_classification_report(y_true=y_true, y_pred=y_pred)
print(df_class_report)

输出:

             precision    recall  f1-score  support
0             0.379032  0.470000  0.419643    400.0
1             0.579365  0.486667  0.528986    600.0
avg / total   0.499232  0.480000  0.485248   1000.0

然后将其保存为csv格式(参见这里以获取其他分隔符格式,如sep =';'):

df_class_report.to_csv('my_csv_file.csv',  sep=',')

我使用LibreOffice Calc打开了my_csv_file.csv文件(你也可以使用任何表格/电子表格编辑器,如Excel): 使用LibreOffice打开的结果


1
classification_report计算的平均值是根据支持值加权的。 - Flynamic
1
因此,应该是 avg = (class_report_df.loc[metrics_sum_index[:-1]] * class_report_df.loc[metrics_sum_index[-1]]).sum(axis=1) / total - Flynamic
2
不错的发现,@Flynamic!我发现precision_recall_fscore_support有一个average参数,正是你建议的那样! - Raul

3

我也发现一些答案有点啰嗦。这里是我的三行解决方案,使用其他人建议的precision_recall_fscore_support

import pandas as pd
from sklearn.metrics import precision_recall_fscore_support

report = pd.DataFrame(list(precision_recall_fscore_support(y_true, y_pred)),
            index=['Precision', 'Recall', 'F1-score', 'Support']).T

# Now add the 'Avg/Total' row
report.loc['Avg/Total', :] = precision_recall_fscore_support(y_true, y_test,
    average='weighted')
report.loc['Avg/Total', 'Support'] = report['Support'].sum()

这个可以工作,但是尝试使用precision_recall_fscore_supportlabels参数会出现一个错误:ValueError: y contains previously unseen labels - Jack Fleeting

3
我找到的最简单、最好的方式是:
classes = ['class 1','class 2','class 3']

report = classification_report(Y[test], Y_pred, target_names=classes)

report_path = "report.txt"

text_file = open(report_path, "w")
n = text_file.write(report)
text_file.close()

2

除了示例输入输出之外,这是另一个函数metrics_report_to_df()。从Sklearn度量中实现precision_recall_fscore_support即可:

# Generates classification metrics using precision_recall_fscore_support:
from sklearn import metrics
import pandas as pd
import numpy as np; from numpy import random

# Simulating true and predicted labels as test dataset: 
np.random.seed(10)
y_true = np.array([0]*300 + [1]*700)
y_pred = np.random.randint(2, size=1000)

# Here's the custom function returning classification report dataframe:
def metrics_report_to_df(ytrue, ypred):
    precision, recall, fscore, support = metrics.precision_recall_fscore_support(ytrue, ypred)
    classification_report = pd.concat(map(pd.DataFrame, [precision, recall, fscore, support]), axis=1)
    classification_report.columns = ["precision", "recall", "f1-score", "support"] # Add row w "avg/total"
    classification_report.loc['avg/Total', :] = metrics.precision_recall_fscore_support(ytrue, ypred, average='weighted')
    classification_report.loc['avg/Total', 'support'] = classification_report['support'].sum() 
    return(classification_report)

# Provide input as true_label and predicted label (from classifier)
classification_report = metrics_report_to_df(y_true, y_pred)

# Here's the output (metrics report transformed to dataframe )
In [1047]: classification_report
Out[1047]: 
           precision    recall  f1-score  support
0           0.300578  0.520000  0.380952    300.0
1           0.700624  0.481429  0.570703    700.0
avg/Total   0.580610  0.493000  0.513778   1000.0

网页内容由stack overflow 提供, 点击上面的
可以查看英文原文,
原文链接