在圆内均匀生成一个随机点
9
以下内容或许能帮助对算法速度有兴趣的人选择合适的算法:最快的方法可能是拒绝采样。
只需在单位正方形内生成一个点并拒绝它,直到它在圆内。例如(伪代码),
def sample(r=1):
    while True:
        x = random(-1, 1)
        y = random(-1, 1)
        if x*x + y*y <= 1:
            return (x, y) * r
虽然有时可能会运行一次或两次以上(并且它不是常数时间或适合并行执行),但它比使用复杂公式如sin或cos要快得多。
4
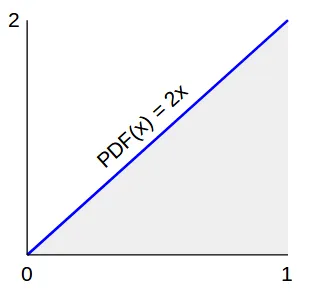
sqrt(...) 的调用。(当且仅当 x <= 1 时,sqrt(x) 将是 <= 1) - aioobeSqrt更快的方法:R = max(random(), random())
theta = random() * 2 * PI
然后:
x = centerX + r * cos(theta)
y = centerY + r * sin(theta)
为什么它有效? < p > < code > sqrt(random()) 和 < code > max(random(), random()) 的PDF是相同的。 < / p >
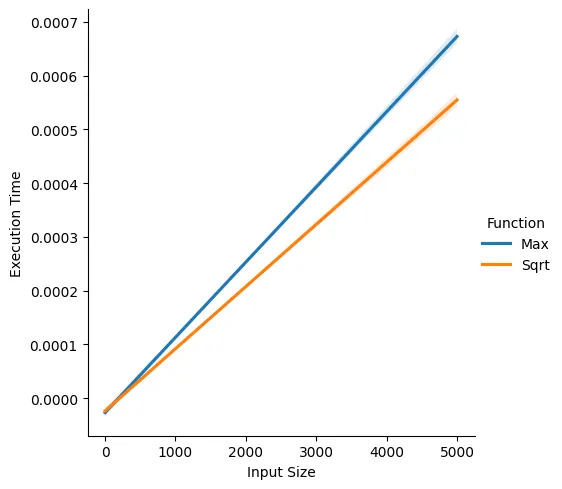
时间比较:
对我来说真奇怪!至少在我提供的代码中,这并不比sqrt更快。
以下是这些函数:
def f1(n):
    for i in range(n):
        x, y = random.random(), random.random()
        x = x if x > y else y
def f2(n):
    for i in range(n):
        x = math.sqrt(random.random())
这是绘图代码。
import random
import timeit
import numpy as np
import pandas as pd
import seaborn as sns
import math

l = 1000
repeat = 10

x_values = list(range(1, l))
y_values_func1 = []
y_values_func2 = []

for n in range(1, l):
  if not n % 100: print(n)
  y1, y2 = 0, 0
  y_values_func1.append(timeit.timeit(lambda: f1(n), number=repeat)/repeat)
  y_values_func2.append(timeit.timeit(lambda: f2(n), number=repeat)/repeat)


data = pd.DataFrame({
    'Input Size': x_values * 2,
    'Execution Time': y_values_func1 + y_values_func2,
    'Function': ['Max'] * len(x_values) + ['Sqrt'] * len(x_values)
})

# Use Seaborn to create the regression plots without scatter points
sns.lmplot(x='Input Size', y='Execution Time', hue='Function', data=data, scatter=False)
7
sqrt比额外的random调用要快,但是我还没有运行过时间测试。)顺便问一下,为什么你把这个答案发了两次?你想删除之前的版本吗? - Mark Dickinsonmath.sqrt,而不是np.sqrt!(除非你想将sqrt应用于NumPy数组,当然,在这种情况下请使用np.sqrt。但这不是发生在这里的情况。) - Mark Dickinson- 你能展示一下你的计时代码吗?
- 为什么你要为
max_f做这么多次赋值?使用x = max(random.random(), random.random())会更高效吧? - 我认为速度应该很大程度上取决于所使用的伪随机数生成器(PRNG)。例如,xoshiro/xoroshiro类的生成器与
Random的MT19937相比在性能上非常出色,并且在统计上与之相匹配甚至超越。你可以使用numpy的新位生成器架构来测试PRNG的影响。 - Python很流行,但你的发现可能不适用于其他编程语言。
max函数不针对两个变量进行优化。3, 4) 是的,你是对的。这在很大程度上取决于伪随机数生成器(PRNG)。 - PeymanJava语言解决方案及示例代码(2000分)
public void getRandomPointInCircle() {
    double t = 2 * Math.PI * Math.random();
    double r = Math.sqrt(Math.random());
    double x = r * Math.cos(t);
    double y = r * Math.sin(t);
    System.out.println(x);
    System.out.println(y);
}
基于之前解决方案https://dev59.com/wG025IYBdhLWcg3wtobX#5838055,来自@sigfpe的
首先,我们生成一个 cdf[x],它是指距离圆心距离为 x 的点的概率。假设圆的半径为 R。
显然,如果 x 是零,则 cdf[0] = 0
显然,如果 x 是 R,则 cdf[R] = 1
显然,如果 x = r,则 cdf[r] = (Pi r^2)/(Pi R^2)
这是因为圆上每个“小区域”被选中的概率相同,因此概率与相关区域的面积成比例。给定距离圆心距离为 x 的区域的面积为 Pi r^2
所以 cdf[x] = x^2/R^2,因为 Pi 相互抵消了
我们有 cdf[x]=x^2/R^2,其中 x 范围从 0 到 R
因此,我们解出 x
R^2 cdf[x] = x^2

x = R Sqrt[ cdf[x] ]
我们现在可以用0到1之间的随机数来替换cdf。
x = R Sqrt[ RandomReal[{0,1}] ]
最后
r = R Sqrt[  RandomReal[{0,1}] ];
theta = 360 deg * RandomReal[{0,1}];
{r,theta}
我们获得了极坐标 {0.601168 R,311.915度}。
1
bool[,] getMatrix(System.Drawing.Rectangle r) {
bool[,] matrix = new bool[r.Width, r.Height];
return matrix;
}
void fillMatrix(ref bool[,] matrix, Vector center) {
double radius = center.X;
Random r = new Random();
for (int y = 0; y < matrix.GetLength(0); y++) {
for (int x = 0; x < matrix.GetLength(1); x++)
{
double distance = (center - new Vector(x, y)).Length;
if (distance < radius) {
matrix[x, y] = r.NextDouble() > 0.5;
}
}
}
}
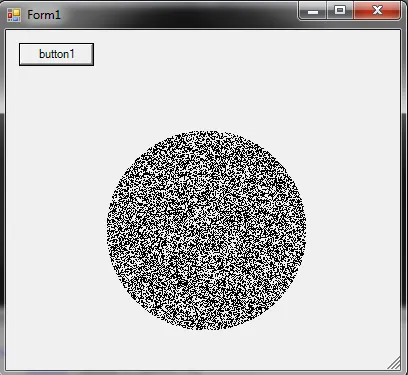
private void drawMatrix(Vector centerPoint, double radius, bool[,] matrix) {
var g = this.CreateGraphics();
Bitmap pixel = new Bitmap(1,1);
pixel.SetPixel(0, 0, Color.Black);
for (int y = 0; y < matrix.GetLength(0); y++)
{
for (int x = 0; x < matrix.GetLength(1); x++)
{
if (matrix[x, y]) {
g.DrawImage(pixel, new PointF((float)(centerPoint.X - radius + x), (float)(centerPoint.Y - radius + y)));
}
}
}
g.Dispose();
}
private void button1_Click(object sender, EventArgs e)
{
System.Drawing.Rectangle r = new System.Drawing.Rectangle(100,100,200,200);
double radius = r.Width / 2;
Vector center = new Vector(r.Left + radius, r.Top + radius);
Vector normalizedCenter = new Vector(radius, radius);
bool[,] matrix = getMatrix(r);
fillMatrix(ref matrix, normalizedCenter);
drawMatrix(center, radius, matrix);
}
1
一个圆的面积是pi*r^2。
当r=1时,
这给我们一个面积为pi。假设我们有某种函数f,它会在圆内均匀分布N=10个点。这里的比率是10/pi。
现在我们将面积和点数翻倍,
当r=2且N=20时,
这给出了一个面积为4pi,比率现在为20/4pi或10/2pi。比率随着半径的增加而变得越来越小,因为它的增长是二次的,而N则按线性比例缩放。
为了解决这个问题,我们可以说:
x = r^2
sqrt(x) = r
如果您想这样生成极坐标下的向量
length = random_0_1();
angle = random_0_2pi();
更多的点会落在中心附近。
length = sqrt(random_0_1());
angle = random_0_2pi();
length 不再是均匀分布的,但向量现在将是均匀分布的。
因此,要生成均匀分布在圆上的点,请从平坦分布中选择phi,并从1/r分布中选择r。
或者使用Mehrdad提出的蒙特卡罗方法。
编辑
要在1/r中平坦地选择随机r,可以从区间[1/R,无穷大]中选择随机x并计算r=1/x。然后,r在1/r中平坦分布。
要计算随机phi,请从区间[0,1]中选择随机x并计算phi=2*pi*x。
1
这是一个有趣的问题。
在轴原点距离增加时,点被选中的概率降低的原理在上面已经解释了多次。我们通过取U [0,1]的根来考虑这一点。
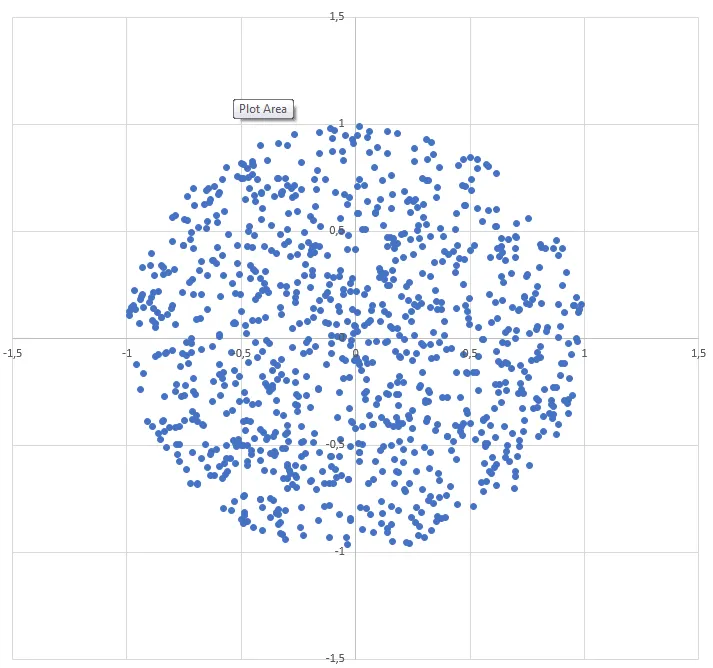
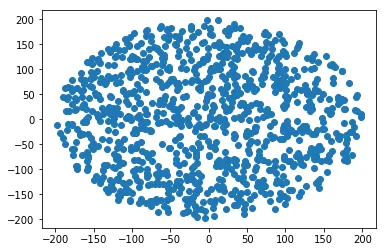
以下是Python 3中正数r的通用解决方案。
import numpy
import math
import matplotlib.pyplot as plt

def sq_point_in_circle(r):
    """
    Generate a random point in an r radius circle
    centered around the start of the axis
    """

    t = 2*math.pi*numpy.random.uniform()
    R = (numpy.random.uniform(0,1) ** 0.5) * r

    return(R*math.cos(t), R*math.sin(t))

R = 200 # Radius
N = 1000 # Samples

points = numpy.array([sq_point_in_circle(R) for i in range(N)])
plt.scatter(points[:, 0], points[:,1])
半径和“附近”该半径的点数之间存在线性关系,因此他需要使用一个半径分布,使得在半径r附近的数据点数量与r成比例。
我仍然不确定确切的“(2/R2)×r”是什么,但显而易见的是,在给定单位“dr”中需要分布的点数,即r的增加将与r2成比例,而不是r。
检查这种方式...在某个角度θ和r(0.1r到0.2r之间)之间的点数,即r的一部分和r(0.6r到0.7r之间)之间的点数将相等,如果您使用标准生成,则差异仅为两个间隔之间的0.1r。但是,由于在点之间覆盖的区域(从0.6r到0.7r)要比在0.1r到0.2r之间覆盖的区域大得多,因此相等数量的点将稀疏地分布在更大的区域中,我认为您已经知道了这一点。因此,生成随机点的函数必须不是线性的,而是二次的(因为需要在给定单位'dr'中分布所需的点数与r²成比例,而不是r),因此在这种情况下,它将是二次的倒数,因为我们有(0.1r)的增量在两个间隔中都必须是某个函数的平方,以便它可以作为点的线性生成的种子值(因为之后,该种子在sin和cos函数中被线性使用),因此我们知道,dr必须是二次值,并且为了使这个种子二次,我们需要从r的平方根而不是r本身开始,我希望这能让它更清晰一些。
4
原文链接