我在Zeppelin 0.7笔记本中使用Spark 2和Scala 2.11。我有一个数据框,可以像这样打印:
dfLemma.select("text", "lemma").show(20,false)
输出结果如下:
+---------------------------------------------------------------------------------------------------------------------------+-----------------------------------------------------------------------------------------------------------------------------------------------------------------------+
|text                                                                                                                       |lemma                                                                                                                                                                  |
+---------------------------------------------------------------------------------------------------------------------------+-----------------------------------------------------------------------------------------------------------------------------------------------------------------------+
|RT @Dope_Promo: When you and your crew beat your high scores on FUGLY FROG  https://time.com/Sxp3Onz1w8                    |[rt, @dope_promo, :, when, you, and, you, crew, beat, you, high, score, on, FUGLY, FROG, https://time.com/sxp3onz1w8]                                                      |
|RT @axolROSE: Did yall just call Kermit the frog a lizard?  https://time.com/wDAEAEr1Ay                                        |[rt, @axolrose, :, do, yall, just, call, Kermit, the, frog, a, lizard, ?, https://time.com/wdaeaer1ay]                                                                     |
我正在尝试通过以下方式优化Zeppelin的输出:
val printcols= dfLemma.select("text", "lemma")
println("%table " + printcols)
它会产生以下输出:
printcols: org.apache.spark.sql.DataFrame = [text: string, lemma: array<string>]
以及一个新的空白Zeppelin段落标题
[text: string, lemma: array]
有没有一种方法可以让数据框以漂亮格式的表格形式显示?TIA!
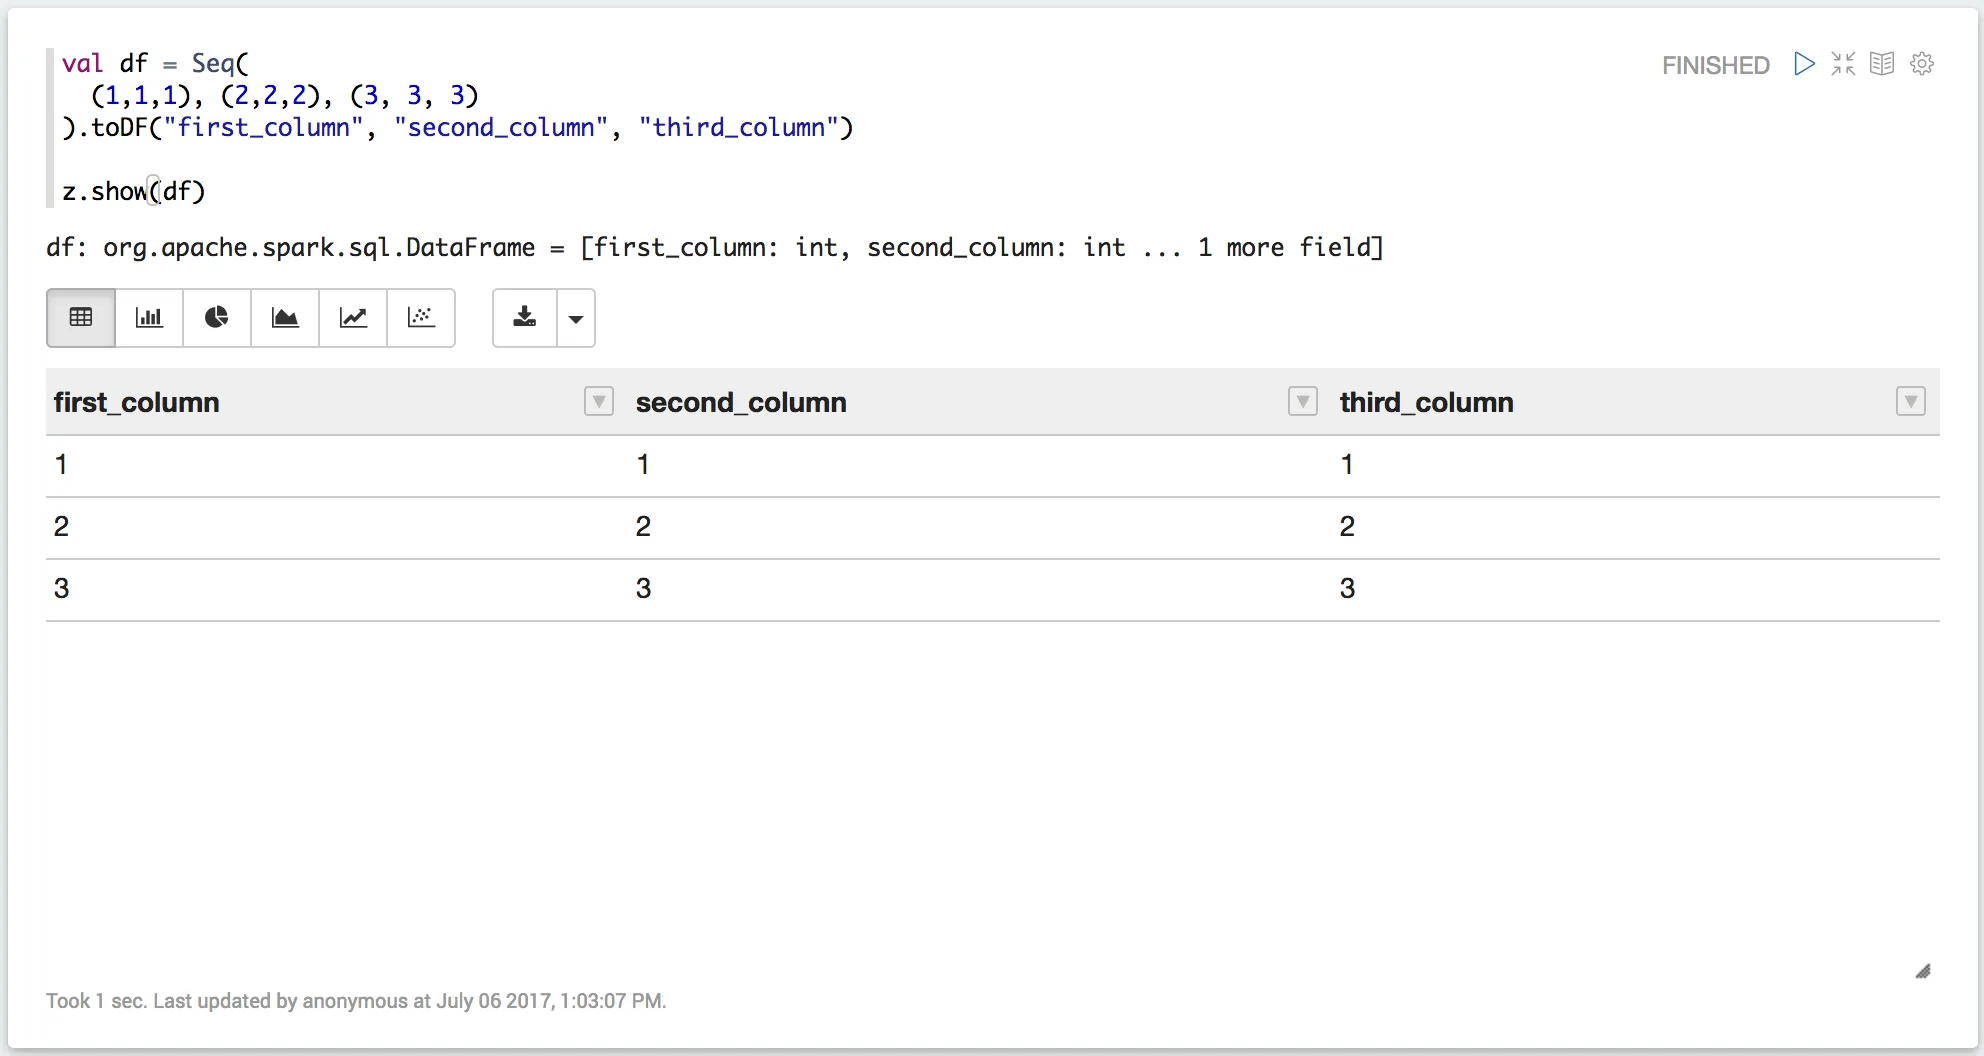

z.show(df, 10)- Daniel de Paula