在ggplot2中,如何将图表标题放在图表底部。
qplot(rnorm(100)) + ggtitle("My Title")
将标题放在图表的中间和顶部,但我希望它在图表的中间和底部。
这里是使用 grid.text 的解决方案:
library("grid")
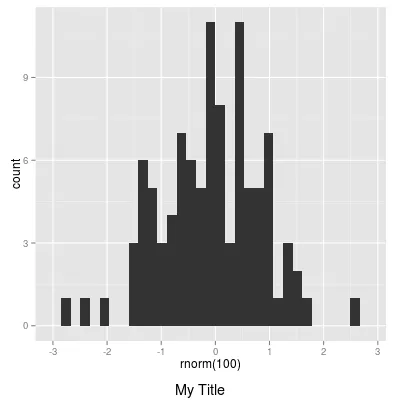
qplot(rnorm(100)) + theme(plot.margin=unit(c(0.5, 1, 2, 0.5), "lines"))
grid.text("My Title", x = unit(0.5, "npc"), y = unit(0, "npc"),
vjust = -0.5, gp = gpar(cex=1.2))
pdf("file.pdf"); print(qplot(...)); grid.text(...); dev.off() - rcs使用开发版,您可以使用标题参数(caption argument)。
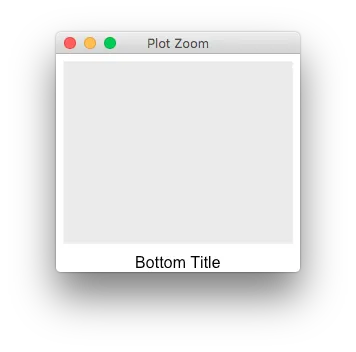
ggplot() +
  labs(caption="Bottom Title") +
  theme(plot.caption = element_text(hjust=0.5, size=rel(1.2)))
或者,将图形包装在grid.arrange()中,
gridExtra::grid.arrange(ggplot(), bottom="Bottom Title")