jqPlot调整大小

3
告诉我,如果有人遇到了这个问题:
我在我的页面上使用jqPlot绘制图表。
<script language="javascript" type="text/javascript">

    $(document).ready(function () {
            $.jqplot.config.enablePlugins = true;
            var chLines = [[['09/30/2010 00:00:00',24.13],['12/31/2010 00:00:00',28.26],['03/31/2011 00:00:00',24.00],['06/30/2011 00:00:00',25.35],['09/30/2011 00:00:00',26.26],['12/31/2011 00:00:00',29.71]]];
            var chSeries = [{       color: '#436277',       label: 'label'  }];
        var mnth;
        var quarter;

        $.jqplot.DateTickFormatter = function(format, val) {
            if (!format) {
                format = '%Y/%m/%d';
            }       

            if(format == '%Q') {
                mnth = $.jsDate.strftime(val, '%#m');
                quarter = parseInt((mnth-1) / 3) + 1;
                return $.jsDate.strftime(val, '%Y') + 'Q' + quarter;
            }
            return $.jsDate.strftime(val, format);
        };

        //$.jqplot.DateAxisRenderer.tickInterval = 86400000*32*3;

        var plot = $.jqplot('content-chart', chLines,
            {
                //animate: !$.jqplot.use_excanvas, // Only animate if we're not using excanvas (not in IE 7 or IE 8)..           
                axes: {
                    xaxis: {
                        tickInterval: 86400000*32*3,
                        renderer: $.jqplot.DateAxisRenderer,
                        borderColor: 'black',
                        borderWidth: 0.5,
                        tickOptions: {
                            showGridline: false,
                            //formatString: '%b %Y',
                            formatString: '%Q',
                            textColor: 'black',
                            fontSize: '11px',
                        }
                    },
                    yaxis: {
                        min: 0,
                        tickOptions: {
                            formatString: '%.2f',
                            textColor: 'black',
                            fontSize: '11px'
                        }
                    }
                },
                highlighter: {
                    show: true,
                    sizeAdjust: 7.5
                },
                seriesDefaults: {
                    lineWidth: 3
                },

                series: chSeries,
                legend: {
                    show: true,
                    location: 'sw',//compass direction, nw, n, ne, e, se, s, sw, w.
                    xoffset: 5,
                    yoffset: 5
                    //placement: 'outside'
                },

                grid:{
                    background: 'white',
                    borderColor: 'white',
                    shadow: false,
                    gridLineColor: '#999999'
                }
            });
            $(window).bind('resize', function(event, ui) {              
                plot.replot( { resetAxes: true } );
            });
    });
</script>

我发现X轴的刻度标签是重复的 enter image description here

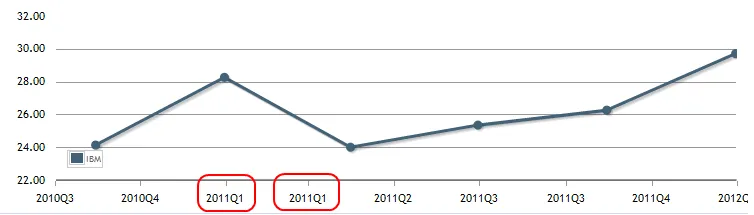
但是当窗口大小改变时,jqplot.dateAxisRenderer.js中的this.tickInterval对象在createTicks函数中变为null。我尝试修改createTicks函数中的代码,如下所示:

this.tickInterval = 86400000 * 32 * 3;
var tickInterval = this.tickInterval;

不幸的是,当窗口调整大小时,刻度标签开始相互重叠。

2个回答

2
为了解决您的问题,您首先需要为日期轴(即X轴)设置“min”和“max”日期。显然,只有在设置了“min”和“max”值后,渲染器才会使用“tickInterval”的值。这种问题实际上已经在stackoverflow上得到解决,请参见此答案
因此,根据此建议,您需要设置以下参数:
tickInterval: "3 months",   
min: chLines[0][0][0],
max: chLines[0][0][chLines[0].length-1]

如果要调整大小,您需要使用以下内容:

$(window).bind('resize', function(event, ui) {    
    if (plot) {
        plot.replot();
    }
});

这里是一个可以用于你的代码的工作样例。


编辑: 在尝试了一段时间的示例后,我观察到还有一些问题,虽然看不见是因为格式覆盖了它。似乎设置minmaxtickInterval是不够的,因为值仍然不是每3个月,因为每个刻度显示的是30天,有时应该是31天。

那么我发现唯一的解决方案就是自己设置刻度。 在这种情况下,您不再需要minmaxtickInterval


@DmitryFisenko 请查看我的 EDIT,我通过直接设置来确保刻度之间相隔三个月。 - Boro

0

网页内容由stack overflow 提供, 点击上面的
可以查看英文原文,
原文链接