这是一个完全可行的解决方案,带有
Stackblitz演示链接,可以合并相似的单元格。
您需要为每个项目计算一次“rowspan”,并将其绑定到“td”的“rowspan”属性上。您还必须有条件地呈现“td”,仅在每个州的第一个项目中显示它。
为此,您可以创建一个预处理数组,按状态和县排序,并添加了状态和县的“span”属性。
要设置“span”属性,您可以通过过滤原始数组来计算每个州和州的子级数量。
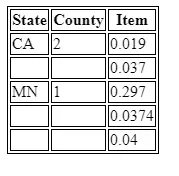
目标是获得像这样的数组:
[
  {state: "CA", county: "2", item: 0.019, stateSpan: 3, countySpan: 2},
  {state: "CA", county: "2", item: 0.037, stateSpan: 0, countySpan: 0},
  {state: "CA", county: "3", item: 0.14, stateSpan: 0, countySpan: 1},
  {state: "MN", county: "1", item: 0.297, stateSpan: 4, countySpan: 3},
  {state: "MN", county: "1", item: 0.04, stateSpan: 0, countySpan: 0},
  {state: "MN", county: "1", item: 0.0374, stateSpan: 0, countySpan: 0},
  {state: "MN", county: "3", item: 0.14, stateSpan: 0, countySpan: 1}
]
这是代码:
 <table>
    <tr>
      <th>State</th>
      <th>County</th>
      <th>Item</th>
    </tr>
    <tr *ngFor="let item of dataExt">
      <td [attr.rowspan]="item.stateSpan" *ngIf="item.stateSpan">{{ item.state }}</td>
      <td [attr.rowspan]="item.countySpan" *ngIf="item.countySpan">{{ item.county }}</td>
      <td>{{ item.item }}</td>
    </tr>
</table>
export class AppComponent {
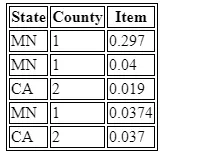
data = [
{ state: 'MN', county: '1', item: 0.297 },
{ state: 'MN', county: '1', item: 0.04 },
{ state: 'MN', county: '3', item: 0.14 },
{ state: 'CA', county: '2', item: 0.019 },
{ state: 'MN', county: '1', item: 0.0374 },
{ state: 'CA', county: '2', item: 0.037 },
{ state: 'CA', county: '3', item: 0.14 }
];
dataExt: any[] = [];
constructor() {
this.processData();
}
private processData() {
const statesSeen = {};
const countiesSeen = {};
this.dataExt = this.data.sort((a, b) => {
const stateComp = a.state.localeCompare(b.state);
return stateComp ? stateComp : a.county.localeCompare(b.county);
}).map(x => {
const stateSpan = statesSeen[x.state] ? 0 :
this.data.filter(y => y.state === x.state).length;
statesSeen[x.state] = true;
const countySpan = countiesSeen[x.state] && countiesSeen[x.state][x.county] ? 0 :
this.data.filter(y => y.state === x.state && y.county === x.county).length;
countiesSeen[x.state] = countiesSeen[x.state] || {};
countiesSeen[x.state][x.county] = true;
return { ...x, stateSpan, countySpan };
});
}
}
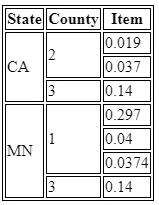
这是生成的表格: