在使用ggplot2制作分面图时,我发现当同时指定分组参数时,在每个分面中获取单独的标签会有问题。如果不指定group = ...,就没事了,但我想制作强调治疗前后变化的配对数据的图表。
这是一个例子:
library(tidyr)
library(ggplot2)

set.seed(253)
data <- data.frame(Subject = LETTERS[1:10],
                   Day1.CompoundA = rnorm(10, 4, 2),
                   Day2.CompoundA = rnorm(10, 7, 2),
                   Day1.CompoundB = rnorm(10, 5, 2),
                   Day2.CompoundB = rnorm(10, 5.5, 2))

# Compare concentration of compounds by day
A <- t.test(data$Day1.CompoundA, data$Day2.CompoundA, paired = TRUE)
B <- t.test(data$Day1.CompoundB, data$Day2.CompoundB, paired = TRUE)

data.long <- gather(data, key = DayCompound, value = Concentration, -Subject) %>%
      separate(DayCompound, c("Day", "Compound"))

# text to annotate graphs
graphLabels <- data.frame(Compound = c("CompoundA", "CompoundB"),
                          Pval = paste("p =", c(signif(A$p.value, 2),
                                                signif(B$p.value, 2))))
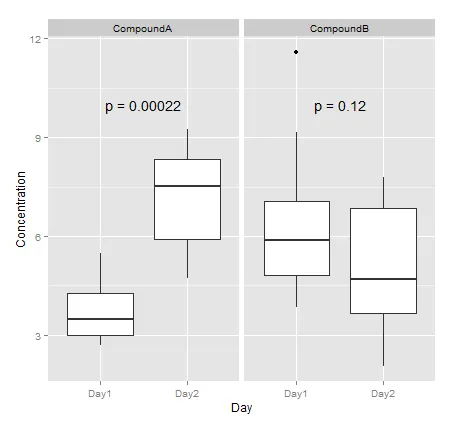
好的,现在数据已经准备好了,我可以成功地制作出箱线图:
ggplot(data.long, aes(x = Day, y = Concentration)) +
      geom_boxplot() +
      facet_wrap(~ Compound) +
      geom_text(data = graphLabels, aes(x = 1.5, y = 10, label = Pval))
但是,如果我想展示突出数据成对性质的折线图并使用不同颜色显示每个受试者的数据,则将无法使用分面标签。
ggplot(data.long, aes(x = Day, y = Concentration, color = Subject, group = Subject)) +
      geom_point() + geom_line() +
      facet_wrap(~ Compound) +
      geom_text(data = graphLabels, aes(x = 1.5, y = 10, label = Pval))

# Error in eval(expr, envir, enclos) : object 'Subject' not found
有什么建议吗?