我想要使用 gnuplot 制作一个径向(极坐标)图(即在圆形坐标系(r,theta)中)。
这里我使用了以下数值:
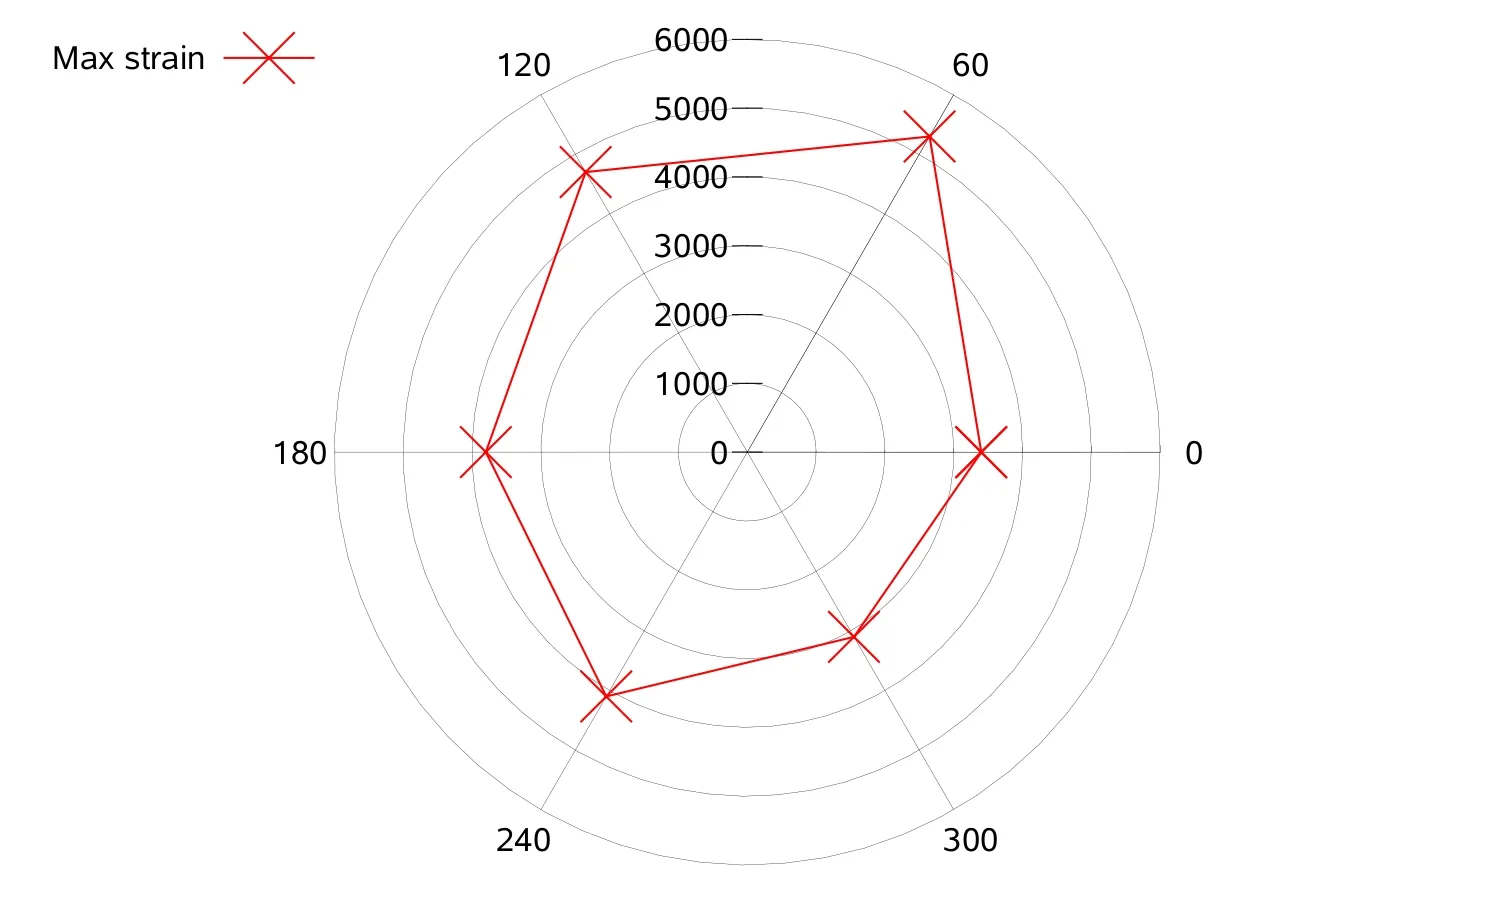
Theta Max-strain
0     3400
60    5300
120   4700
180   3800
240   4100
300   3100
360   3400
如何使用 GNU-plot 获取这样的图形?
我想要使用 gnuplot 制作一个径向(极坐标)图(即在圆形坐标系(r,theta)中)。
这里我使用了以下数值:
Theta Max-strain
0 3400
60 5300
120 4700
180 3800
240 4100
300 3100
360 3400
如何使用 GNU-plot 获取这样的图形?
我试图重现你问题的情节,以下是我的成果:
unset border
set polar
set angles degrees #set gnuplot on degrees instead of radians

set style line 10 lt 1 lc 0 lw 0.3 #redefine a new line style for the grid

set grid polar 60 #set the grid to be displayed every 60 degrees
set grid ls 10

set xrange [-6000:6000] #make gnuplot to go until 6000
set yrange [-6000:6000]

set xtics axis #disply the xtics on the axis instead of on the border
set ytics axis

set xtics scale 0 #"remove" the tics so that only the y tics are displayed
set xtics ("" 1000, "" 2000, "" 3000, "" 4000, "" 5000, "" 6000) #set the xtics only go from 0 to 6000 with increment of1000 but do not display anything. This has to be done otherwise the grid will not be displayed correctly.
set ytics 0, 1000, 6000 #make the ytics go from the center (0) to 6000 with incrment of 1000

set size square

set key lmargin

set_label(x, text) = sprintf("set label '%s' at (6500*cos(%f)), (6500*sin(%f))     center", text, x, x) #this places a label on the outside

#here all labels are created
eval set_label(0, "0")
eval set_label(60, "60")
eval set_label(120, "120")
eval set_label(180, "180")
eval set_label(240, "240")
eval set_label(300, "300")


set style line 11 lt 1 lw 2 pt 2 ps 2 #set the line style for the plot

#and finally the plot
plot "-" u 1:2 t "Max strain" w lp ls 11
0 3400
60 5300
120 4700
180 3800
240 4100
300 3100
360 3400
e
正如您所看到的,主要区别在于角度0不在顶部而在右侧(这在数学上是正确的)。但是可以通过修改绘图中的减速度和set_label函数来更改它。
正如您在脚本中看到的,不是所有事情都很精细和闪亮。如果有人发现改进,请让我知道!
最后的“建议”:并非总是合理地尝试使用gnuplot从某些工具重现绘图。通常,gnuplot的优势在于以最简单的方式绘制数据,以便轻松复制。也许您可以从上面的脚本中去掉一些行,并仍然对其感到满意。
"-" 替换为包含值的文件名。就像这样:plot "Data.dat" u 1:2 ...。 - Woltan set polar
set angles degrees
set grid polar
set grid polar 30 将添加每隔 30 度的网格线。 - osgx