在 R 中,您无法像在 Excel 中那样合并 data.frame 的单元格,但您可以组合Country和period列。下面是使用dplyr + tidyr的解决方案:
library(dplyr)
library(tidyr)

df %>%
  gather(var, value, Month:Year) %>%
  unite("var", Country, var) %>%
  spread(var, value)
结果:
       Variable   CA_Month CA_Quarter  CA_Year   US_Month US_Quarter  US_Year
1     Inflation  0.2760235   1.758310 4.233976 -0.4321298  3.6232025 5.149919
2 Interest rate -0.5208693   1.227022 3.412022  1.2283928  3.6858872 3.495870
3  Unemployment -1.0489755   1.531800 3.634362  1.6898725  0.9299318 1.665646
要创建一个(用于报告的)已合并Country的表格,可以使用tables包中的一行代码来完成:
library(tables)

tabular(Variable ~  Heading()*Country*Heading()*identity*(Month + Quarter + Year), data=df)
结果:
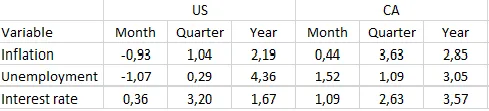
               CA                    US
 Variable      Month   Quarter Year  Month   Quarter Year
 Inflation      0.5269 2.152   3.854 -0.9456 3.764   1.432
 Interest rate  1.3974 1.820   3.340  0.4520 1.734   3.962
 Unemployment  -0.2303 3.377   3.419 -0.6652 2.486   2.739
tabular使用其独特的表达式来生成表格式:
~将行表达式与列表达式分开。我正在显示Variable的行。
*表示您正在将一个列嵌套到另一个列中。在这种情况下,我正在将Month:Year列嵌套在Country中。
identity指定在每个单元格中显示实际值。
Heading用字符串替换下一个项目的标题。在这种情况下,我将"Country"和"identity"替换为空白。
要输出为latex,可以使用latex函数包装整个表达式:
latex(tabular(Variable ~ Heading()*Country*Heading()*identity*(Month + Quarter + Year), data=df))
结果:
\begin{tabular}{lcccccc}
\hline
 & \multicolumn{6}{c}{Country} \\
 & \multicolumn{3}{c}{CA} & \multicolumn{3}{c}{US} \\
Variable  & Month & Quarter & Year & Month & Quarter & \multicolumn{1}{c}{Year} \\
\hline
Inflation  & $\phantom{-}0.5269$ & $2.152$ & $3.854$ & $-0.9456$ & $3.764$ & $1.432$ \\
Interest rate  & $\phantom{-}1.3974$ & $1.820$ & $3.340$ & $\phantom{-}0.4520$ & $1.734$ & $3.962$ \\
Unemployment  & $-0.2303$ & $3.377$ & $3.419$ & $-0.6652$ & $2.486$ & $2.739$ \\
\hline
\end{tabular}

library(data.table);dcast(setDT(df), Variable ~ Country, value.var = c('Month', 'Quarter', 'Year'))进行编程。 - akrun