如何使用ROCR软件包计算AUC

22
我已经用ROCR包拟合了一个SVM模型并创建了ROC曲线。我该如何计算曲线下面积(AUC)?

我使用ROCR包拟合SVM模型并绘制了ROC曲线,如何计算曲线下面积(AUC)?

set.seed(1)
tune.out=tune(svm ,Negative~.-Positive, data=trainSparse, kernel ="radial",ranges=list(cost=c(0.1,1,10,100,1000),gamma=c(0.5,1,2,3,4) ))
summary(tune.out)
best=tune.out$best.model

##prediction on the test set
ypred = predict(best,testSparse, type = "class")
table(testSparse$Negative,ypred)
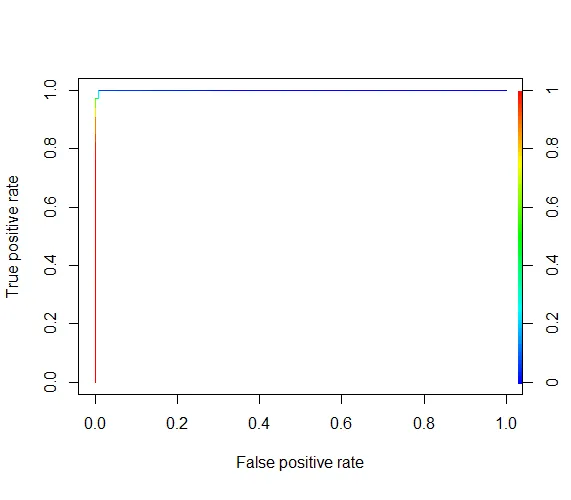
###Roc curve
yhat.opt = predict(best,testSparse,decision.values = TRUE)
fitted.opt = attributes(yhat.opt)$decision.values
rocplot(fitted.opt,testSparse ["Negative"], main = "Test Data")## 

你好,欢迎来到StackOverflow!你可能想阅读这篇文章:https://dev59.com/eG025IYBdhLWcg3whGSx - Tobia Tesan
4个回答

28

ROCR 包的 prediction 方法开始。

pred_ROCR <- prediction(df$probabilities, df$target)

在图表中获取ROC:

roc_ROCR <- performance(pred_ROCR, measure = "tpr", x.measure = "fpr")
plot(roc_ROCR, main = "ROC curve", colorize = T)
abline(a = 0, b = 1)

获取AUC值:

  auc_ROCR <- performance(pred_ROCR, measure = "auc")
  auc_ROCR <- auc_ROCR@y.values[[1]]

6

你的例子似乎不完整,因此我无法运行它并相应地进行更改,但请尝试插入类似以下内容:

...
prediction.obj <- prediction(...)
perf <- performance(prediction.obj, measure = "auc")
print("AUC: ", perf@y.values)

您可以将它附加在 sandipan的代码 之后,这样只会得到绘图。
参考ROCR手册中关于performance的内容,第5页: ftp://ftp.auckland.ac.nz/pub/software/CRAN/doc/packages/ROCR.pdf " auc "是performance可能产生的一种度量标准。

2

计算AUC

# Outcome Flag & Predicted probability
roc_val <-roc(testing.label,gbmPred) 

plot(roc_val,col='blue')

auc(roc_val)

2

试试这个:

tune.out=tune(svm ,Negative~.-Positive, data=trainSparse, kernel ="radial",
              ranges=list(cost=c(0.1,1,10,100,1000),gamma=c(0.5,1,2,3,4), 
              probability = TRUE)) # train svm with probability option true
summary(tune.out)
best=tune.out$best.model
yhat.opt = predict(best,testSparse,probability = TRUE)

# Roc curve
library(ROCR)
# choose the probability column carefully, it may be 
# probabilities[,1] or probabilities[,2], depending on your factor levels 
pred <- prediction(attributes(yhat.opt)$probabilities[,2], testSparse$Negative) 
perf <- performance(pred,"tpr","fpr")
plot(perf,colorize=TRUE)

enter image description here


什么是df?当我运行该命令时,它显示:df$Negative <- as.factor(df$Negative) Error in df$Negative : object of type 'closure' is not subsettable @sandipan - mac gionny
df是原始数据框(你将其分成两个部分,训练集和测试集),你不需要担心它,只需确保变量Negative是一个因子。 - Sandipan Dey
没问题,因为我已经这样做了:tweets$Negative= as.factor(tweets$Sent<=-1),而你命令的另一部分也很好用;谢谢,当我达到15个声望时,我会给你点赞的!! @sandipan - mac gionny

网页内容由stack overflow 提供, 点击上面的
可以查看英文原文,
原文链接