Matlab 3D图(surf,mesh,surfc)中的次要y轴

12

我正在尝试在一个三维图中添加一个具有不同单位的次要y轴。

输入图像描述
[m2_array, ~ , ~] = F_readBin('amb.bin');
amb = m2_array(:,:,lat);

surfc(light,'LineWidth',0.001); 
ylim([1 24]); xlim([1 size(light,2)]); title(['@ ',num2str(lat),'°N']);
xticks([0:50:size(m2_array,2)]);
labels=cellstr(num2str((day_start:50:day_end)')); xticklabels(labels);
xlabel('Season days'); ylabel('Daytime{[hours]}');zlabel('surface light 
[\mumol m^2 s^-^1]')
colormap winter;

然而,我能找到的所有解决方案(例如yyaxis)似乎仅适用于二维图。是否有一种方法可以解决surf、mesh、surfc图的问题?


1
请看这个链接:https://uk.mathworks.com/matlabcentral/answers/95949-is-there-a-function-to-include-two-3-d-plots-with-different-z-axes-on-the-same-plot-area-similar-to - Ander Biguri
1
不幸的是,它们都不能同时启用多个Z轴标签和编号。 - Larusson
你想要多个 z 轴还是多个 y 轴? - gnovice
2个回答

9
我不确定这是否是您要寻找的内容,但我猜想在3D图中添加副坐标轴的基本方法与2D相同(据我所知,在Matlab中2D图只是从上方查看的3D图)。您需要将第二组坐标轴放在第一组上方,然后调整以适应您的需求,例如隐藏未使用的坐标轴并使第二背景透明。这在Matlab文档here中有解释。对于3D,由于默认的轴和标签位置,这有点棘手,但这就是undocumentedmatlab的用武之地。使用Axes的NumericRuler对象(XAxis、YAxis、ZAxis)的FirstCrossOverValue和SecondCrossoverValue属性,我们可以将副坐标轴定位在所需位置。以下示例说明了基本思路。这是针对z轴的,但是y或x也可以使用相同的方法。
clear; close all; clc

% Dummy data from matlab example
[X,Y,Z] = peaks(25);

% Primary axes with some arbitrary viewpoint and labels
hs = surf(X,Y,Z); % Get surface object
ha = hs.Parent; % Get parent Axes
ha.View = [25, 40]; % Set arbitrary view point
xlabel 'xa';
ylabel 'ya';
zlabel 'za';
grid on

% Secondary axes on top of primary, using same view point
hb = axes('view',ha.View);
hb.ZLim = [0 7]; % Arbitrary axis limits
zlabel 'zb'; 

% Hide secondary background and x and y rulers
hb.Color = 'none'; % Transparent background
hb.XAxis.Visible = 'off';
hb.YAxis.Visible = 'off';

% Move z-ruler to opposite corner (from undocumentedmatlab)
hb.ZAxis.FirstCrossoverValue = 1; % x-location of z-ruler [normalized]
hb.ZAxis.SecondCrossoverValue = 1; % y-location of z-ruler [normalized]

请注意,当您开始手动旋转轴或缩放时,此基本示例会出现故障。您需要添加一些方法来将两个轴连接在一起,以解决这个问题。
结果如下: 三维图中次要轴的示例

1
+1. 您可以使用linkaxeslinkprop链接轴和属性,可能结合使用hggroups来缓解您在最后一段提到的问题。 - Tasos Papastylianou

6

Dennis的答案所示,您可以利用一些未记录的功能添加额外的轴。这有一些缺点,明显的是未记录的功能往往会在没有通知的情况下更改。此外,在同样的方式(即在相反的一侧)添加额外的xy轴将导致它被图表遮挡并且不太有用。像这个问题的答案中所示,在3D中实现轴堆叠在一侧的效果将更加理想。然而,这可能会有些混乱,我还没有找到一种与绘图变化(即旋转、缩放、更改限制等)良好协作的稳健方法。

不需要添加另一个轴线,更紧凑的解决方案是利用现有轴线的刻度线,并在新比例尺上简单地添加额外的刻度标签。可以使用TeX标记对额外的刻度(和轴)标签进行着色以区分它们。

我将一些代码包装到原型函数中来实现此功能。输入为轴句柄、字符串('X''Y''Z')用于修改轴、新比例尺的轴限制(将映射到当前限制)、新标签的颜色(作为RGB三元组),以及新轴标签的字符串:
function add_scale(hAxes, axisStr, newLimits, newColor, newLabel)

  % Get axis ruler to modify:
  axisStr = upper(axisStr);
  hRuler = get(hAxes, [axisStr 'Axis']);

  % Create TeX color modification strings:
  labelColor = ['\color[rgb]{' sprintf('%f ', hRuler.Label.Color) '}'];
  tickColor = ['\color[rgb]{' sprintf('%f ', hRuler.Color) '}'];
  newColor = ['\color[rgb]{' sprintf('%f ', newColor) '}'];

  % Compute tick values for new axis scale:
  tickValues = hRuler.TickValues;
  limits = hRuler.Limits;
  newValues = newLimits(1)+...
              diff(newLimits).*(tickValues-limits(1))./diff(limits);

  % Create new tick labels:
  formatString = ['\' tickColor hRuler.TickLabelFormat '\\newline\' ...
                  newColor hRuler.TickLabelFormat '\n'];
  newTicks = strsplit(sprintf(formatString, [tickValues; newValues]), '\n');

  % Update tick and axis labels:
  hRuler.Label.String = {[labelColor hRuler.Label.String]; ...
                         [newColor newLabel]};
  hRuler.TickLabels = newTicks(1:(end-1));

end

这里是一个例子:

[X, Y, Z] = peaks(25);
hSurf = surfc(Z);
hAxes = gca;
ylabel('Distance (inches)');
add_scale(hAxes, 'Y', hAxes.YLim.*2.54, [1 0 0], 'Distance (cm)');

enter image description here

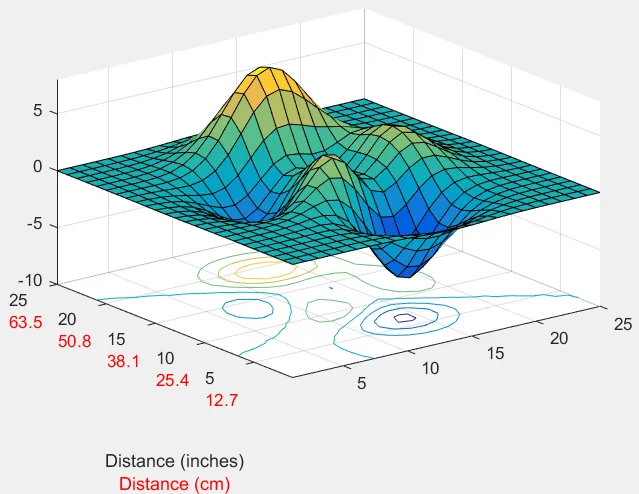
新的刻度标签(红色)添加在现有刻度标签下方,新的轴标签也是如此。可能可以创建监听器以自动更新新标签(例如当刻度标记更改时),但我尚未完全解决这些细节问题。

这很漂亮和优雅!我不确定您如何在原始轴值和添加的轴值之间进行同步(它可能是不同的数据,不仅仅是对现有值进行简单计算),但我猜这是可以解决的,并且也相当特定于此处的情况。 - EBH
1
@EBH:这只是一个简单的线性值映射。如果原始轴的限制为 [lowerLimit upperLimit],那么 newLimits(1) 将映射到 lowerLimit,而 newLimits(2) 将映射到 upperLimit。然后相应地缩放刻度值以获得新的标签值。 - gnovice

网页内容由stack overflow 提供, 点击上面的
可以查看英文原文,
原文链接