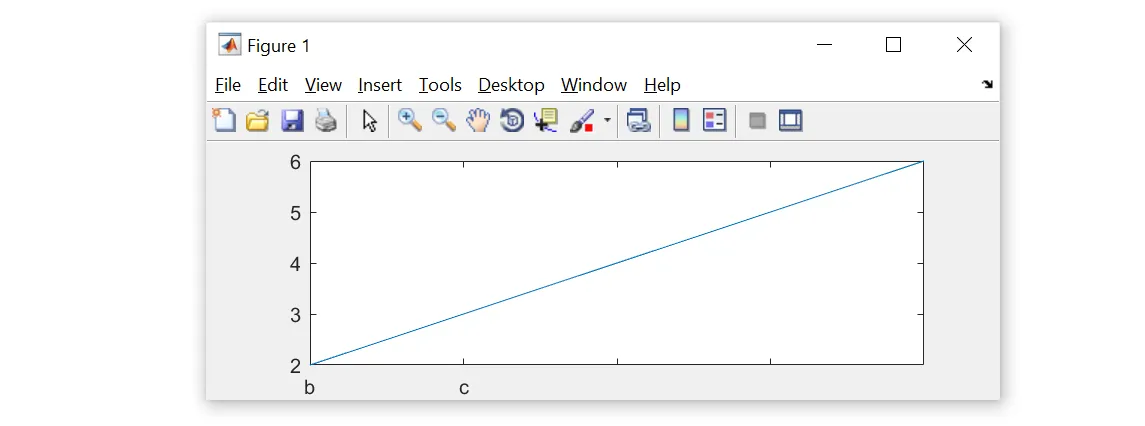
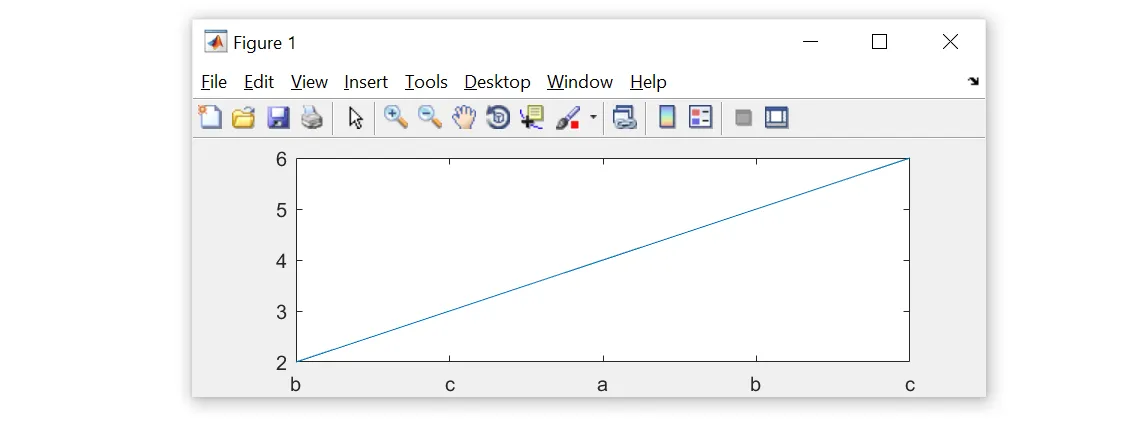
我发现了Matlab的xticklabels和yticklabels的行为有些不直观。我把xticklabels的输出存储到一个变量中,然后修改它,再应用它,就会注意到标签现在被移动了。如果这是预期的行为,那么为什么呢?(可选:为什么将其作为预期行为是有意义的?)
思路:显示每个步骤的xticks,但只显示每个第二个步骤的标签。
思路:显示每个步骤的xticks,但只显示每个第二个步骤的标签。
%setup a figure to display
figure;
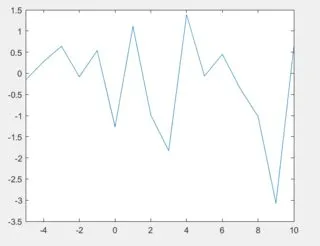
data=randn(1,21);
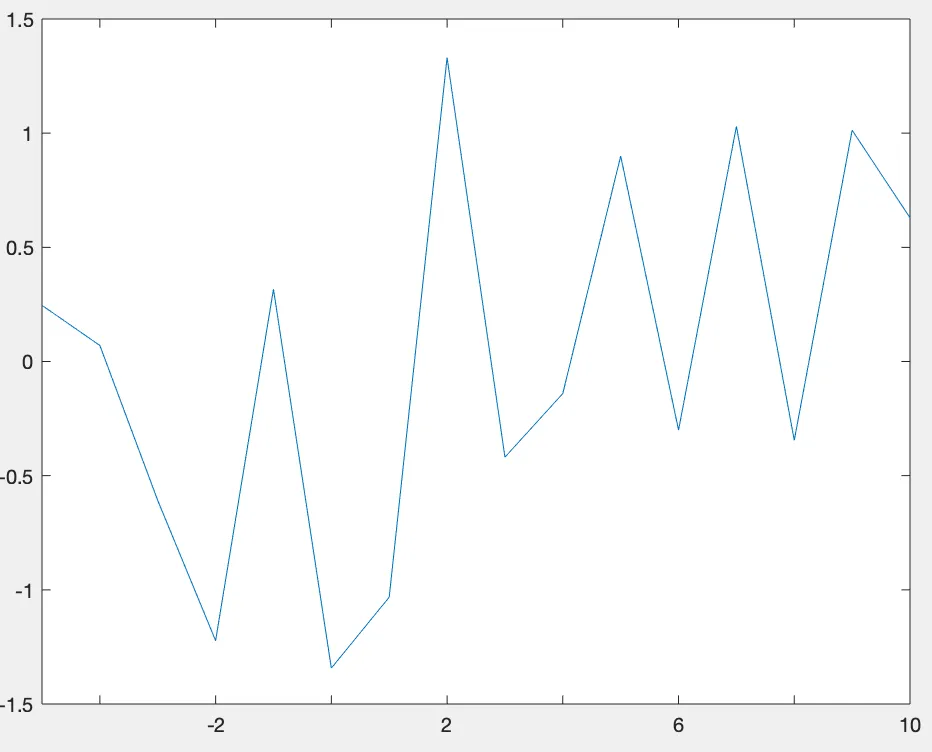
plot(-10:10,data);
xlim([-5 10]) %cut out a piece of interest from the data
xticks(-10:2:10); %adjust tick spacing to favorite
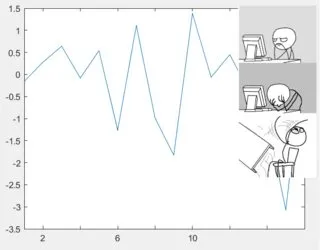
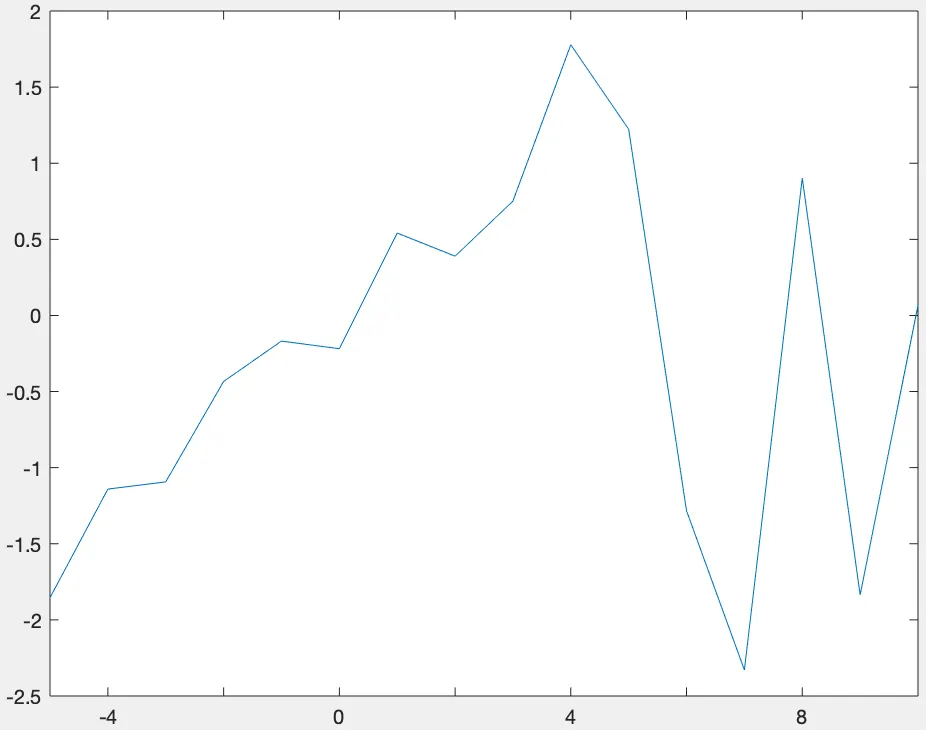
%now: keep xticks but remove every 2nd label
lbls=xticklabels;
lbls(1:2:end)={' '}; %set every 2nd label to empty space
pause(1); %take a deep breath...
xticklabels(lbls)
xticklabel函数只返回可见刻度的标签”。它似乎要复杂一些;请参考我的回答。 - Luis Mendo