Octave方法(可能也适用于Matlab)
老实说,我不会依赖LaTeX的花招来做这个。
这是我通常做类似事情的方式。
有效地,由于轴标签对象被认为是单个对象,您无法将其分成部分,技巧是叠加一个无形的、最少的轴对象,仅定义您想要的标签,并将其视为您所希望的那样处理(例如,调整其字体重量,字体大小,x颜色等等)。
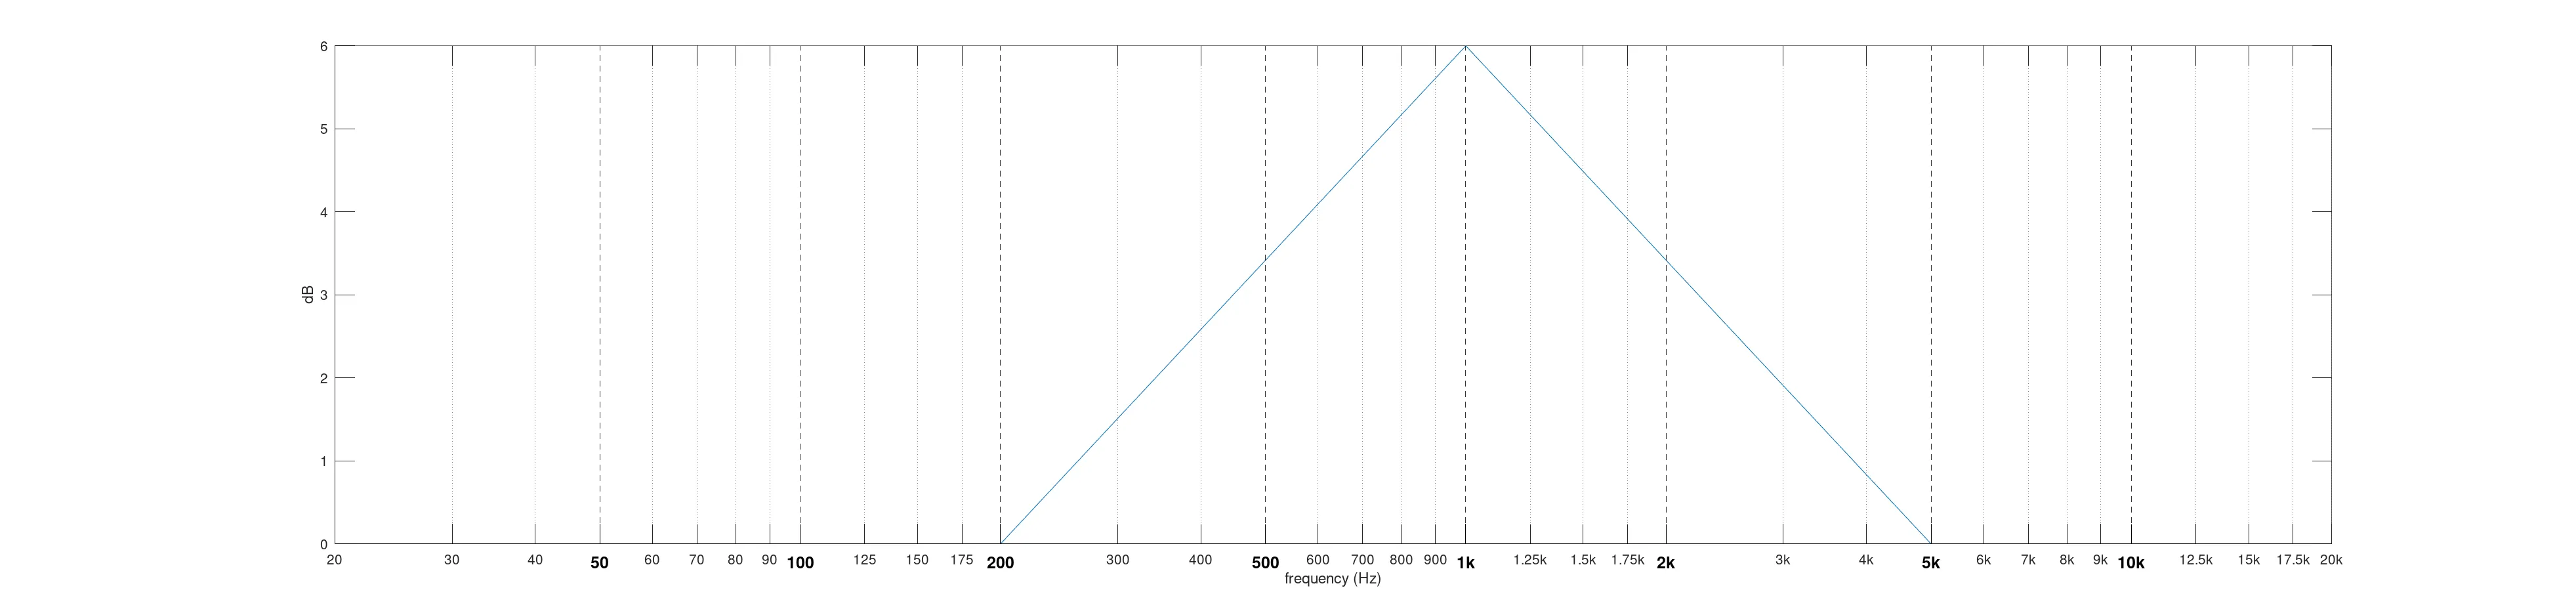
H = semilogx([200,1000,5000], [0,6,0]);
A = gca();
B = axes();

subscale = [20:10:100,125:25:175];
scale    = [subscale,subscale * 10,subscale * 100, 20000];

ScaleTextLabels = {};
for i = 1 : length( scale )
    if scale(i) >= 1000, ScaleTextLabels{i} = sprintf("%dk", scale(i) / 1000 );
    else,                ScaleTextLabels{i} = num2str( scale(i) );
    end
end

SpecialTickLabels   = { '50', '100', '200', '500', '1k', '2k', '5k', '10k'};
ScaleIndices        = 1 : length( ScaleTextLabels );
SpecialIndices      = nthargout( 2, @ismember, SpecialTickLabels, ScaleTextLabels );
NormalIndices       = setdiff( ScaleIndices, SpecialIndices );

set( A, 'xgrid', 'on', 'xlabel', 'frequency (Hz)', 'xlim', [20 20000]      , 'xminorgrid', 'off', 'xminortick', 'off', 'xticklabel', ScaleTextLabels(NormalIndices),  'xtick', scale(NormalIndices) , 'ylabel', 'dB', 'gridlinestyle', ':', 'gridcolor', 'k', 'gridalpha', 0.5 );
set( B, 'xgrid', 'on', 'xlabel', ''              , 'xlim', get( A, 'xlim' ), 'xminorgrid', 'off', 'xminortick', 'off', 'xticklabel', ScaleTextLabels(SpecialIndices), 'xtick', scale(SpecialIndices), 'ylabel', ''  , 'color', 'none', 'fontsize', 12, 'fontweight', 'bold', 'position', get( A, 'position'), 'xcolor', [0,0,0], 'xscale', 'log', 'ylim', get( A, 'ylim'), 'ytick', [], 'gridlinestyle', '--', 'gridcolor', 'k', 'gridalpha', 0.8 );
这种“透明轴对象层次”技术通常非常有用,它可在设计复杂图表时提供很大的灵活性。:)
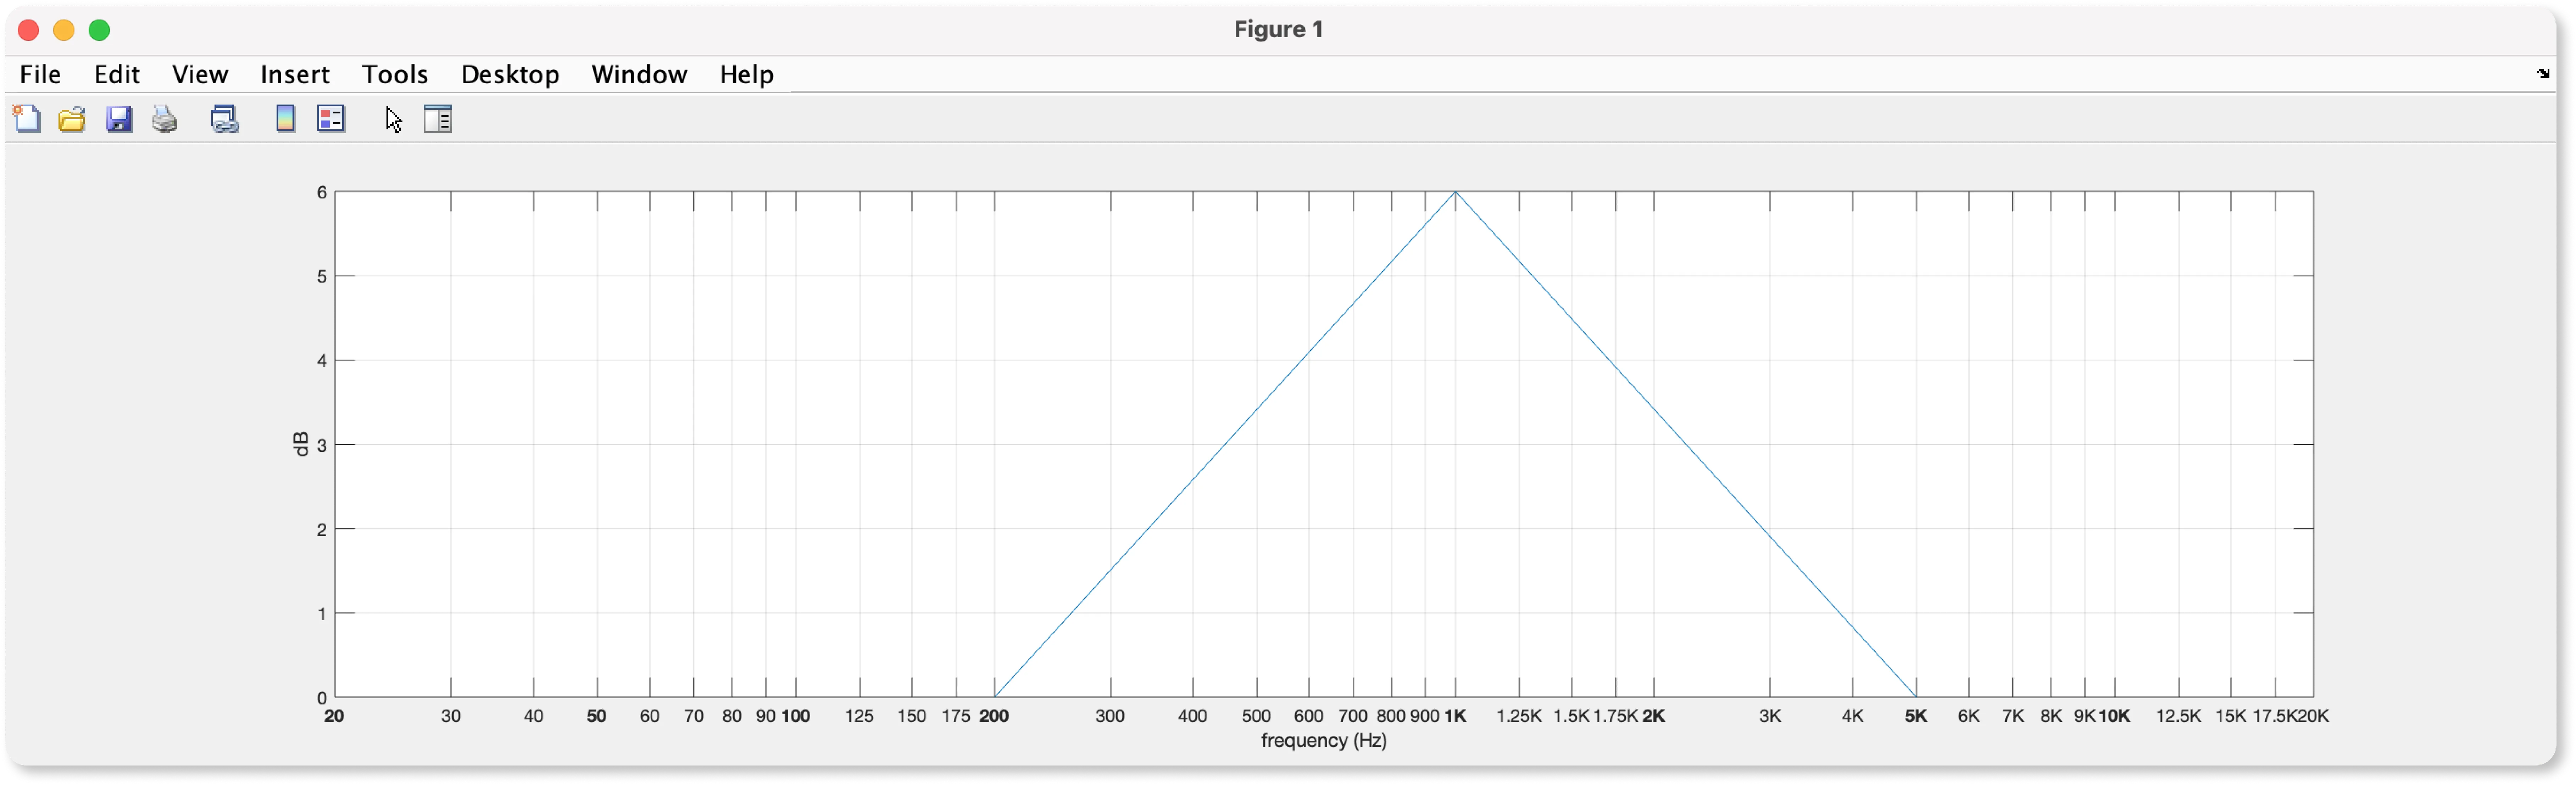
set(gca,'linewidth',1);设置当前轴线宽来解决问题。我在我的答案中添加了一个代码片段来更改网格可见性。 - MichaelTr7