我正在尝试在ggplot2中生成坐标轴线断点(在轴线上方使用白色线段),但是遇到了一些问题。
使用这篇有用的文章annotate-ggplot-with-an-extra-tick-and-label,我能够在给定位置生成自定义的grobs,并关闭面板以在绘图区域之外进行“绘制”。
我还熟悉其他软件包,如plotrix,可以在基础软件中复制断轴,但最重要的是我想学习为什么我创建的轴grobs不能覆盖线条。这是一些示例代码:
这将创建此图像: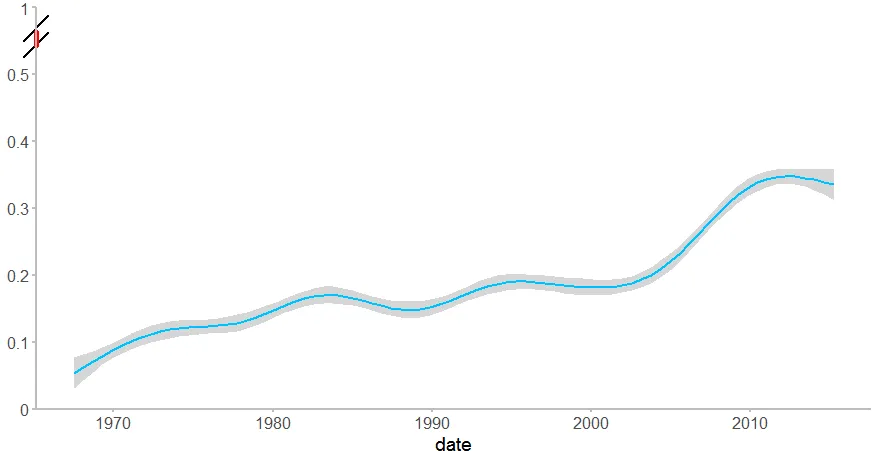 我很好奇为什么annotation_custom grobs被放置在轴线下面,是否有更好的解决方案来使用ggplot2添加自定义grobs。似乎有一种顺序将图形放置在绘图窗口中 - 如何交替以便自定义grobs在轴线之后放置?
使用这篇有用的文章annotate-ggplot-with-an-extra-tick-and-label,我能够在给定位置生成自定义的grobs,并关闭面板以在绘图区域之外进行“绘制”。
我还熟悉其他软件包,如plotrix,可以在基础软件中复制断轴,但最重要的是我想学习为什么我创建的轴grobs不能覆盖线条。这是一些示例代码:
library(ggplot2) # devtools::install_github("hadley/ggplot2")
library(grid)
library(scales)


data("economics_long")
econ <- economics_long
econ$value01 <- (econ$value01/2)
x <- ggplot(econ, aes(date, value01,group=1)) + scale_y_continuous(labels=c(0.0,0.1,0.2,0.3,0.4,0.5,1.0), breaks=c(0.0,0.1,0.2,0.3,0.4,0.5,0.6),limits = c(0,.6),expand = c(0, 0)) +
  geom_smooth(colour="deepskyblue", show.legend = TRUE ) + theme_bw()

theme_white <- theme(panel.background=element_blank(),
                     panel.border=element_rect(color="white"),
                     plot.margin = unit(c(.2, 0, .2, .2), "cm"),
                     panel.grid.major.y=element_blank(),
                     panel.grid.major.x=element_blank(),
                     panel.grid.minor.x=element_blank(),
                     panel.grid.minor.y=element_blank(),
                     axis.title.y = element_blank(),
                     axis.line.x=element_line(color="gray", size=1),
                     axis.line.y=element_line(color="gray", size=1),
                     axis.text.x=element_text(size=12),
                     axis.text.y=element_text(size=12),
                     axis.ticks=element_line(color="gray", size=1),
                     legend.position="none"
)
x <- x + theme_white


gline = linesGrob(y = c(0, 1.5),x = c(-.015, .015),  gp = gpar(col = "black", lwd = 2.5))
gline2 = linesGrob(y = c(-0.25, 0.5),x = c(0, 0),  gp = gpar(col = "red", lwd = 5))

p = x + annotation_custom(gline, ymin=.55, ymax=.575, xmin=-Inf, xmax=Inf) +
  annotation_custom(gline, ymin=.525, ymax=.55, xmin=-Inf, xmax=Inf) +
  annotation_custom(gline2, ymin=.55, ymax=.575, xmin=-Inf, xmax=Inf)

# grobs are placed under the axis lines....

g = ggplotGrob(p)
g$layout$clip[g$layout$name=="panel"] <- "off"
grid.draw(g)
这将创建此图像:
我很好奇为什么annotation_custom grobs被放置在轴线下面,是否有更好的解决方案来使用ggplot2添加自定义grobs。似乎有一种顺序将图形放置在绘图窗口中 - 如何交替以便自定义grobs在轴线之后放置?