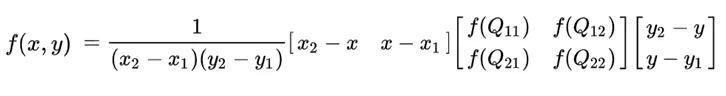
如何在Python中执行双线性插值

31
我希望使用Python进行双线性插值。
我要插值的示例GPS点是:
B = 54.4786674627
L = 17.0470721369

使用已知坐标和高度值的四个相邻点:

n = [(54.5, 17.041667, 31.993), (54.5, 17.083333, 31.911), (54.458333, 17.041667, 31.945), (54.458333, 17.083333, 31.866)]

z01    z11

     z
z00    z10

import math
z00 = n[0][2]
z01 = n[1][2]
z10 = n[2][2]
z11 = n[3][2]
c = 0.016667 #grid spacing
x0 = 56 #latitude of origin of grid
y0 = 13 #longitude of origin of grid
i = math.floor((L-y0)/c)
j = math.floor((B-x0)/c)
t = (B - x0)/c - j
z0 = (1-t)*z00 + t*z10
z1 = (1-t)*z01 + t*z11
s = (L-y0)/c - i
z = (1-s)*z0 + s*z1


z01  z0  z11

     z
z00  z1   z10
2022年修订:
我想感谢那些即使在这个问题发表十多年后仍然给予新答案的人们。

3
你的计算中有舍入误差,并且你在进行取整操作?如果去掉“floor”会发生什么? - Ben
2
L和B是什么?您想要进行插值的点的坐标是什么? - machine yearning
@机器学习没错 - daikini
一个注意事项 - 纬度和经度不是平面坐标,因此如果您处理的是大距离,这个结果将无法满足您的要求。 - chris
9个回答

55

下面是一个可重用的函数,它包括文档测试和数据验证:

def bilinear_interpolation(x, y, points):
    '''Interpolate (x,y) from values associated with four points.

    The four points are a list of four triplets:  (x, y, value).
    The four points can be in any order.  They should form a rectangle.

        >>> bilinear_interpolation(12, 5.5,
        ...                        [(10, 4, 100),
        ...                         (20, 4, 200),
        ...                         (10, 6, 150),
        ...                         (20, 6, 300)])
        165.0

    '''
    # See formula at:  http://en.wikipedia.org/wiki/Bilinear_interpolation

    points = sorted(points)               # order points by x, then by y
    (x1, y1, q11), (_x1, y2, q12), (x2, _y1, q21), (_x2, _y2, q22) = points

    if x1 != _x1 or x2 != _x2 or y1 != _y1 or y2 != _y2:
        raise ValueError('points do not form a rectangle')
    if not x1 <= x <= x2 or not y1 <= y <= y2:
        raise ValueError('(x, y) not within the rectangle')

    return (q11 * (x2 - x) * (y2 - y) +
            q21 * (x - x1) * (y2 - y) +
            q12 * (x2 - x) * (y - y1) +
            q22 * (x - x1) * (y - y1)
           ) / ((x2 - x1) * (y2 - y1) + 0.0)

你可以通过添加以下代码来运行测试:

if __name__ == '__main__':
    import doctest
    doctest.testmod()

对你的数据集运行插值会产生以下结果:

>>> n = [(54.5, 17.041667, 31.993),
         (54.5, 17.083333, 31.911),
         (54.458333, 17.041667, 31.945),
         (54.458333, 17.083333, 31.866),
    ]
>>> bilinear_interpolation(54.4786674627, 17.0470721369, n)
31.95798688313631

1
@Raymond Hettinger非常感谢您的回答。为什么在这种情况下scipy.interpolate.interp2d不起作用? interp2d不也是双线性插值吗,因为它“在2-D网格上进行插值”(来源:docs.scipy.org/doc/scipy-0.14.0/reference/generated/…)? - DavidC.
1
据我所知,当您使用 kind=linear 时,它是双线性插值。根据经验,我还将此答案与 interp2dkind=linear 的结果进行了比较 - 它们完全相同。@DavidC - Sibbs Gambling

10

我不确定这是否有太大帮助,但是使用scipy进行线性插值时,我得到了一个不同的值:

>>> import numpy as np
>>> from scipy.interpolate import griddata
>>> n = np.array([(54.5, 17.041667, 31.993),
                  (54.5, 17.083333, 31.911),
                  (54.458333, 17.041667, 31.945),
                  (54.458333, 17.083333, 31.866)])
>>> griddata(n[:,0:2], n[:,2], [(54.4786674627, 17.0470721369)], method='linear')
array([ 31.95817681])

4
griddata 在一个单纯形(三角形)中进行线性插值,而不是在矩形中进行双线性插值;这意味着它首先进行三角剖分(Delaunay?)。 - sastanin

7

受到这里的启发,我提供以下代码片段。该API被优化用于多次重复使用同一张表:

from bisect import bisect_left

class BilinearInterpolation(object):
    """ Bilinear interpolation. """
    def __init__(self, x_index, y_index, values):
        self.x_index = x_index
        self.y_index = y_index
        self.values = values

    def __call__(self, x, y):
        # local lookups
        x_index, y_index, values = self.x_index, self.y_index, self.values

        i = bisect_left(x_index, x) - 1
        j = bisect_left(y_index, y) - 1

        x1, x2 = x_index[i:i + 2]
        y1, y2 = y_index[j:j + 2]
        z11, z12 = values[j][i:i + 2]
        z21, z22 = values[j + 1][i:i + 2]

        return (z11 * (x2 - x) * (y2 - y) +
                z21 * (x - x1) * (y2 - y) +
                z12 * (x2 - x) * (y - y1) +
                z22 * (x - x1) * (y - y1)) / ((x2 - x1) * (y2 - y1))

你可以这样使用它:
table = BilinearInterpolation(
    x_index=(54.458333, 54.5), 
    y_index=(17.041667, 17.083333), 
    values=((31.945, 31.866), (31.993, 31.911))
)

print(table(54.4786674627, 17.0470721369))
# 31.957986883136307

此版本没有错误检查,如果您尝试在索引边界(或之外)使用它,您将会遇到问题。要获取完整代码版本,包括错误检查和可选的外推,请点击这里


3

3
一个基于这个公式的numpy实现:

enter image description here

def bilinear_interpolation(x,y,x_,y_,val):

    a = 1 /((x_[1] - x_[0]) * (y_[1] - y_[0]))
    xx = np.array([[x_[1]-x],[x-x_[0]]],dtype='float32')
    f = np.array(val).reshape(2,2)
    yy = np.array([[y_[1]-y],[y-y_[0]]],dtype='float32')
    b = np.matmul(f,yy)

    return a * np.matmul(xx.T, b)

输入: 这里,x_ 是一个包含 [x0,x1] 的列表,而 y_ 是一个包含 [y0,y1] 的列表。

bilinear_interpolation(x=54.4786674627,
                       y=17.0470721369,
                       x_=[54.458333,54.5],
                       y_=[17.041667,17.083333],
                       val=[31.993,31.911,31.945,31.866])

输出:

array([[31.95912739]])

2

我认为进行 floor 函数的目的通常是为了插值一个坐标值位于两个离散坐标之间的值。然而,您似乎已经拥有最接近点的实际坐标值,这使得这个问题变得非常简单。

z00 = n[0][2]
z01 = n[1][2]
z10 = n[2][2]
z11 = n[3][2]

# Let's assume L is your x-coordinate and B is the Y-coordinate

dx = n[2][0] - n[0][0] # The x-gap between your sample points
dy = n[1][1] - n[0][1] # The Y-gap between your sample points

dx1 = (L - n[0][0]) / dx # How close is your point to the left?
dx2 = 1 - dx1              # How close is your point to the right?
dy1 = (B - n[0][1]) / dy # How close is your point to the bottom?
dy2 = 1 - dy1              # How close is your point to the top?

left = (z00 * dy1) + (z01 * dy2)   # First interpolate along the y-axis
right = (z10 * dy1) + (z11 * dy2)

z = (left * dx1) + (right * dx2)   # Then along the x-axis

从您的例子中翻译可能存在一些错误的逻辑,但其要义是,您可以根据每个点距离插值目标点比其其他邻居更近的程度来赋予其权重。


你难道忘了要将 leftrightz 分别除以 dy1+dy2dy1+dy2dx1+dx2 吗? - ovgolovin
我不确定你为什么要这样做。 dx1dx2dy1dy2都被标准化为介于0和1之间的补充值(因此dy1 + dy2始终等于1),因为dx是左邻居和右邻居之间的总距离,dy同理。 - machine yearning
@机器学习 我不确定目标是否清晰,即根据相邻点的高度值31.993、31.911、31.945、31.866,对给定点的高度值进行插值,使其约为31米。 - daikini
@daikini:哈哈,是的,那正是我的目标。我想说的是,使用双线性插值,您可以只沿一个轴进行线性插值以获得两对点,然后在另一个轴上在这两个结果点之间进行线性插值。我认为将所有内容归一化到[0,1]比尝试重新量化离散间隔更有意义。 - machine yearning

2
这是与Scipy中可用的interp2d进行比较的一些函数应用的相同解决方案,其定义与此处相同。我们使用numba库使插值函数比Scipy实现更快速。
import numpy as np
from scipy.interpolate import interp2d
import matplotlib.pyplot as plt

from numba import jit, prange
@jit(nopython=True, fastmath=True, nogil=True, cache=True, parallel=True)
def bilinear_interpolation(x_in, y_in, f_in, x_out, y_out):
    f_out = np.zeros((y_out.size, x_out.size))
    
    for i in prange(f_out.shape[1]):
        idx = np.searchsorted(x_in, x_out[i])
        
        x1 = x_in[idx-1]
        x2 = x_in[idx]
        x = x_out[i]
        
        for j in prange(f_out.shape[0]):
            idy = np.searchsorted(y_in, y_out[j])
            y1 = y_in[idy-1]
            y2 = y_in[idy]
            y = y_out[j]

            
            f11 = f_in[idy-1, idx-1]
            f21 = f_in[idy-1, idx]
            f12 = f_in[idy, idx-1]
            f22 = f_in[idy, idx]


            f_out[j, i] = ((f11 * (x2 - x) * (y2 - y) +
                            f21 * (x - x1) * (y2 - y) +
                            f12 * (x2 - x) * (y - y1) +
                            f22 * (x - x1) * (y - y1)) /
                           ((x2 - x1) * (y2 - y1)))
    
    return f_out

我们制作了一个相当大的插值数组来评估每种方法的性能。
样本函数为,

z(x, y)=\sin \left(\frac{\pi x}{2}\right) e^{y / 2}

x = np.linspace(0, 4, 13)
y = np.array([0, 2, 3, 3.5, 3.75, 3.875, 3.9375, 4])
X, Y = np.meshgrid(x, y)
Z = np.sin(np.pi*X/2) * np.exp(Y/2)

x2 = np.linspace(0, 4, 1000)
y2 = np.linspace(0, 4, 1000)
Z2 = bilinear_interpolation(x, y, Z, x2, y2)

fun = interp2d(x, y, Z, kind='linear')
Z3 = fun(x2, y2)


fig, ax = plt.subplots(nrows=1, ncols=3, figsize=(10, 6))
ax[0].pcolormesh(X, Y, Z, shading='auto')
ax[0].set_title("Original function")
X2, Y2 = np.meshgrid(x2, y2)
ax[1].pcolormesh(X2, Y2, Z2, shading='auto')
ax[1].set_title("bilinear interpolation")

ax[2].pcolormesh(X2, Y2, Z3, shading='auto')
ax[2].set_title("Scipy bilinear function")

plt.show()

enter image description here

性能测试

没有使用 Numba 库的 Python

在这种情况下,bilinear_interpolation 函数与 numba 版本相同,只是我们将 for 循环中的 prange 更改为普通的 Python range,并删除函数装饰器 jit

%timeit bilinear_interpolation(x, y, Z, x2, y2)

每次循环需要7.15秒±107毫秒(平均值±标准差,共进行了7次运行,每次运行1个循环)。

使用Numba的Python

%timeit bilinear_interpolation(x, y, Z, x2, y2) 

给出的是每次循环的时间为2.65毫秒±70.5微秒(7次运行的平均值和标准差,每次100个循环)。

Scipy实现

%%timeit
f = interp2d(x, y, Z, kind='linear')
Z2 = f(x2, y2)

每次循环耗时为6.63毫秒±145微秒(7次运行,每次100个循环的平均值和标准差)。
性能测试在“Intel(R) Core(TM) i7-8700K CPU @ 3.70GHz”上执行。

这个能被修改来处理缺失(NaN)值吗? - Nirmal
可以的,@Nirmal,但需要更多的努力。 - Khalil Al Hooti
scipy.interpolate.griddata 完美地完成了这项工作,但是 Numba 不支持它。 - Nirmal

0
我建议以下解决方案:
def bilinear_interpolation(x, y, z01, z11, z00, z10):

    def linear_interpolation(x, z0, z1):
        return z0 * x + z1 * (1 - x)

    return linear_interpolation(y, linear_interpolation(x, z01, z11),
                                   linear_interpolation(x, z00, z10))

0
一个解决方案展示了双线性插值,我应用了他的方法这里。但是我的改进方法,仅通过计算欧几里得距离到四个角落的接近度,并将其用作简单加权平均值,效果要好得多(我的改进在同一链接中)。
import numpy as np

def func(x, y):
    s1 = 0.2; x1 = 36.5; y1 = 32.5
    s2 = 0.4; x2 = 36.1; y2 = 32.8
    g1 = np.exp( -4 *np.log(2) * ((x-x1)**2+(y-y1)**2) / s1**2)
    g2 = np.exp( -2 *np.log(2) * ((x-x2)**2+(y-y2)**2) / s2**2)    
    return g1 + g2 

D = 20
x = np.linspace(36,37,D)
y = np.linspace(32,33,D)
xx,yy = np.meshgrid(x,y)
zz = func(xx,yy)

def find_corners(xi,yi):
    idx1 = np.searchsorted(x, xi, side="left")
    idx2 = np.searchsorted(y, yi, side="left")
    cs = [(idx2,idx1),(idx2-1,idx1),(idx2,idx1-1),(idx2-1,idx1-1)]
    return cs

def cdist(p1,p2):    
    distances = np.linalg.norm(p1 - p2, axis=1)
    return distances

def cell_interp(x, y, points):
    a = np.array([x,y]).reshape(-1,2)
    b = np.array(points)[:,:2]
    ds = cdist(a,b)
    ds = ds / np.sum(ds)
    ds = 1. - ds
    c = np.array(points)[:,2]
    iz = np.sum(c * ds) / np.sum(ds)
    return iz

def grid_interp(intx,inty):
    cs = find_corners(intx,inty)

    i,j = cs[0][0],cs[0][1]
    i,j = cs[1][0],cs[1][1]
    i,j = cs[2][0],cs[2][1]
    i,j = cs[3][0],cs[3][1]
    
    i0,j0 = cs[0][0],cs[0][1]
    i1,j1 = cs[1][0],cs[1][1]
    i2,j2 = cs[2][0],cs[2][1]
    i3,j3 = cs[3][0],cs[3][1]
    
    introw = [(xx[i0,j0],yy[i0,j0],zz[i0,j0]),
              (xx[i1,j1],yy[i1,j1],zz[i1,j1]),
              (xx[i2,j2],yy[i2,j2],zz[i2,j2]),
              (xx[i3,j3],yy[i3,j3],zz[i3,j3])]
    return cell_interp(intx,inty,introw)

x2 = np.linspace(36.0001,36.9999,D*2)
y2 = np.linspace(32.0001,32.9999,D*2)
xx2,yy2 = np.meshgrid(x2,y2)
zz2 = func(xx2,yy2)

grid_interp_vec = np.vectorize(grid_interp,otypes=[np.float])
zz2_grid = grid_interp_vec(xx2,yy2)
print (np.mean(np.square(zz2-zz2_grid)))

网页内容由stack overflow 提供, 点击上面的
可以查看英文原文,
原文链接