将矩阵转换为图像

20

我该如何将一个由整数列表组成的列表转换为Python中的矩阵图?

数据集示例为:

[[3, 5, 3, 5, 2, 3, 2, 4, 3, 0, 5, 0, 3, 2],
 [5, 2, 2, 0, 0, 3, 2, 1, 0, 5, 3, 5, 0, 0],
 [2, 5, 3, 1, 1, 3, 3, 0, 0, 5, 4, 4, 3, 3],
 [4, 1, 4, 2, 1, 4, 5, 1, 2, 2, 0, 1, 2, 3],
 [5, 1, 1, 1, 5, 2, 5, 0, 4, 0, 2, 4, 4, 5],
 [5, 1, 0, 4, 5, 5, 4, 1, 3, 3, 1, 1, 0, 1],
 [3, 2, 2, 4, 3, 1, 5, 5, 0, 4, 3, 2, 4, 1],
 [4, 0, 1, 3, 2, 1, 2, 1, 0, 1, 5, 4, 2, 0],
 [2, 0, 4, 0, 4, 5, 1, 2, 1, 0, 3, 4, 3, 1],
 [2, 3, 4, 5, 4, 5, 0, 3, 3, 0, 2, 4, 4, 5],
 [5, 2, 4, 3, 3, 0, 5, 4, 0, 3, 4, 3, 2, 1],
 [3, 0, 4, 4, 4, 1, 4, 1, 3, 5, 1, 2, 1, 1],
 [3, 4, 2, 5, 2, 5, 1, 3, 5, 1, 4, 3, 4, 1],
 [0, 1, 1, 2, 3, 1, 2, 0, 1, 2, 4, 4, 2, 1]]

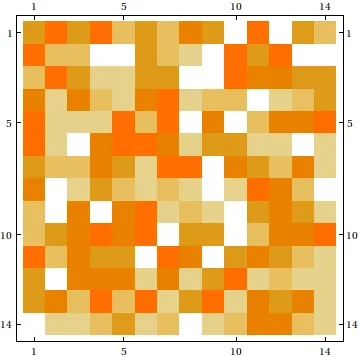
为了让你明白我在寻找什么,Mathematica中的MatrixPlot函数会为这个数据集给出以下图像:

enter image description here

谢谢!

3个回答

17

你可以尝试

from pylab import *
A = rand(5,5)
figure(1)
imshow(A, interpolation='nearest')
grid(True)

在此输入图片描述

来源


interpolation="nearest" 是什么意思?我在寻找有关其功能的文档时遇到了困难。 - Max

9
也许matplotlib中的matshow()函数是你所需要的。

3
也可以使用 pcolor:http://matplotlib.sourceforge.net/examples/pylab_examples/pcolor_demo.html - user57368

0

你也可以使用matplotlib中的pyplot,代码如下:

from matplotlib import pyplot as plt


plt.imshow(
[[3, 5, 3, 5, 2, 3, 2, 4, 3, 0, 5, 0, 3, 2],
 [5, 2, 2, 0, 0, 3, 2, 1, 0, 5, 3, 5, 0, 0],
 [2, 5, 3, 1, 1, 3, 3, 0, 0, 5, 4, 4, 3, 3],
 [4, 1, 4, 2, 1, 4, 5, 1, 2, 2, 0, 1, 2, 3],
 [5, 1, 1, 1, 5, 2, 5, 0, 4, 0, 2, 4, 4, 5],
 [5, 1, 0, 4, 5, 5, 4, 1, 3, 3, 1, 1, 0, 1],
 [3, 2, 2, 4, 3, 1, 5, 5, 0, 4, 3, 2, 4, 1],
 [4, 0, 1, 3, 2, 1, 2, 1, 0, 1, 5, 4, 2, 0],
 [2, 0, 4, 0, 4, 5, 1, 2, 1, 0, 3, 4, 3, 1],
 [2, 3, 4, 5, 4, 5, 0, 3, 3, 0, 2, 4, 4, 5],
 [5, 2, 4, 3, 3, 0, 5, 4, 0, 3, 4, 3, 2, 1],
 [3, 0, 4, 4, 4, 1, 4, 1, 3, 5, 1, 2, 1, 1],
 [3, 4, 2, 5, 2, 5, 1, 3, 5, 1, 4, 3, 4, 1],
 [0, 1, 1, 2, 3, 1, 2, 0, 1, 2, 4, 4, 2, 1]], interpolation='nearest')

plt.show()

输出将会是:

Plot of the matrix


网页内容由stack overflow 提供, 点击上面的
可以查看英文原文,
原文链接