我需要找到一个绘图区域的范围,包括其相关的艺术家(在这种情况下只有刻度和刻度标签),以轴坐标表示(如matplotlib转换教程中定义)。
背景是我正在自动创建缩略图绘图(如此SO问题),用于大量图表,只有当我可以将缩略图定位在不遮挡原始绘图数据的位置时才会使用。
这是我的当前方法:
1. 创建多个候选矩形进行测试,从原始绘图的右上角开始向左移动,然后从原始绘图的右下角开始向左移动。 2. 对于每个候选矩形: - 使用此SO问题中的代码将矩形的左侧和右侧(以轴坐标表示)转换为数据坐标,以查找矩形将覆盖哪个x数据切片。 - 查找矩形覆盖的数据切片的最小/最大y值。 - 查找矩形在数据坐标中的顶部和底部。 - 使用上述内容确定矩形是否与任何数据重叠。如果没有,则在当前矩形中绘制缩略图绘图,否则继续。
这种方法的问题是轴坐标给出的是轴的范围,从
所有图表使用相同的字体大小,但图表具有不同长度的刻度标签(例如
以下代码实现了上述算法:
这个的输出结果是:
背景是我正在自动创建缩略图绘图(如此SO问题),用于大量图表,只有当我可以将缩略图定位在不遮挡原始绘图数据的位置时才会使用。
这是我的当前方法:
1. 创建多个候选矩形进行测试,从原始绘图的右上角开始向左移动,然后从原始绘图的右下角开始向左移动。 2. 对于每个候选矩形: - 使用此SO问题中的代码将矩形的左侧和右侧(以轴坐标表示)转换为数据坐标,以查找矩形将覆盖哪个x数据切片。 - 查找矩形覆盖的数据切片的最小/最大y值。 - 查找矩形在数据坐标中的顶部和底部。 - 使用上述内容确定矩形是否与任何数据重叠。如果没有,则在当前矩形中绘制缩略图绘图,否则继续。
这种方法的问题是轴坐标给出的是轴的范围,从
(0,0)(轴的左下角)到(1,1)(右上角),不包括刻度和刻度标签(缩略图绘图没有标题、轴标签、图例或其他艺术家)。所有图表使用相同的字体大小,但图表具有不同长度的刻度标签(例如
1.5或1.2345 * 10^6),尽管在绘制插图之前已知。是否有一种方法可以将字体大小/点转换为轴坐标?或者,也许有比上面的方法更好的方法(边界框?)。以下代码实现了上述算法:
import math

from matplotlib import pyplot, rcParams
rcParams['xtick.direction'] = 'out'
rcParams['ytick.direction'] = 'out'

INSET_DEFAULT_WIDTH = 0.35
INSET_DEFAULT_HEIGHT = 0.25
INSET_PADDING = 0.05
INSET_TICK_FONTSIZE = 8


def axis_data_transform(axis, xin, yin, inverse=False):
    """Translate between axis and data coordinates.
    If 'inverse' is True, data coordinates are translated to axis coordinates,
    otherwise the transformation is reversed.
    Code by Covich, from: https://dev59.com/QF4b5IYBdhLWcg3wchbs
    """
    xlim, ylim = axis.get_xlim(), axis.get_ylim()
    xdelta, ydelta = xlim[1] - xlim[0], ylim[1] - ylim[0]
    if not inverse:
        xout, yout = xlim[0] + xin * xdelta, ylim[0] + yin * ydelta
    else:
        xdelta2, ydelta2 = xin - xlim[0], yin - ylim[0]
        xout, yout = xdelta2 / xdelta, ydelta2 / ydelta
    return xout, yout


def add_inset_to_axis(fig, axis, rect):
    left, bottom, width, height = rect
    def transform(coord):
        return fig.transFigure.inverted().transform(
            axis.transAxes.transform(coord))
    fig_left, fig_bottom = transform((left, bottom))
    fig_width, fig_height = transform([width, height]) - transform([0, 0])
    return fig.add_axes([fig_left, fig_bottom, fig_width, fig_height])


def collide_rect((left, bottom, width, height), fig, axis, data):
    # Find the values on the x-axis of left and right edges of the rect.
    x_left_float, _ = axis_data_transform(axis, left, 0, inverse=False)
    x_right_float, _ = axis_data_transform(axis, left + width, 0, inverse=False)
    x_left = int(math.floor(x_left_float))
    x_right = int(math.ceil(x_right_float))
    # Find the highest and lowest y-value in that segment of data.
    minimum_y = min(data[int(x_left):int(x_right)])
    maximum_y = max(data[int(x_left):int(x_right)])
    # Convert the bottom and top of the rect to data coordinates.
    _, inset_top = axis_data_transform(axis, 0, bottom + height, inverse=False)
    _, inset_bottom = axis_data_transform(axis, 0, bottom, inverse=False)
    # Detect collision.
    if ((bottom > 0.5 and maximum_y > inset_bottom) or  # inset at top of chart
           (bottom < 0.5 and minimum_y < inset_top)):   # inset at bottom
        return True
    return False


if __name__ == '__main__':
    x_data, y_data = range(0, 100), [-1.0] * 50 + [1.0] * 50  # Square wave.
    y_min, y_max = min(y_data), max(y_data)
    fig = pyplot.figure()
    axis = fig.add_subplot(111)
    axis.set_ylim(y_min - 0.1, y_max + 0.1)
    axis.plot(x_data, y_data)
    # Find a rectangle that does not collide with data. Start top-right
    # and work left, then try bottom-right and work left.
    inset_collides = False
    left_offsets = [x / 10.0 for x in xrange(6)] * 2
    bottom_values = (([1.0 - INSET_DEFAULT_HEIGHT - INSET_PADDING] * (len(left_offsets) / 2))
                     + ([INSET_PADDING * 2] * (len(left_offsets) / 2)))
    for left_offset, bottom in zip(left_offsets, bottom_values):
        # rect: (left, bottom, width, height)
        rect = (1.0 - INSET_DEFAULT_WIDTH - left_offset - INSET_PADDING,
                bottom, INSET_DEFAULT_WIDTH, INSET_DEFAULT_HEIGHT)
        inset_collides = collide_rect(rect, fig, axis, y_data)
        print 'TRYING:', rect, 'RESULT:', inset_collides
        if not inset_collides:
            break
    if not inset_collides:
        inset = add_inset_to_axis(fig, axis, rect)
        inset.set_ylim(axis.get_ylim())
        inset.set_yticks([y_min, y_min + ((y_max - y_min) / 2.0), y_max])
        inset.xaxis.set_tick_params(labelsize=INSET_TICK_FONTSIZE)
        inset.yaxis.set_tick_params(labelsize=INSET_TICK_FONTSIZE)
        inset_xlimit = (0, int(len(y_data) / 100.0 * 2.5)) # First 2.5% of data.
        inset.set_xlim(inset_xlimit[0], inset_xlimit[1], auto=False)
        inset.plot(x_data[inset_xlimit[0]:inset_xlimit[1] + 1],
                   y_data[inset_xlimit[0]:inset_xlimit[1] + 1])
    fig.savefig('so_example.png')
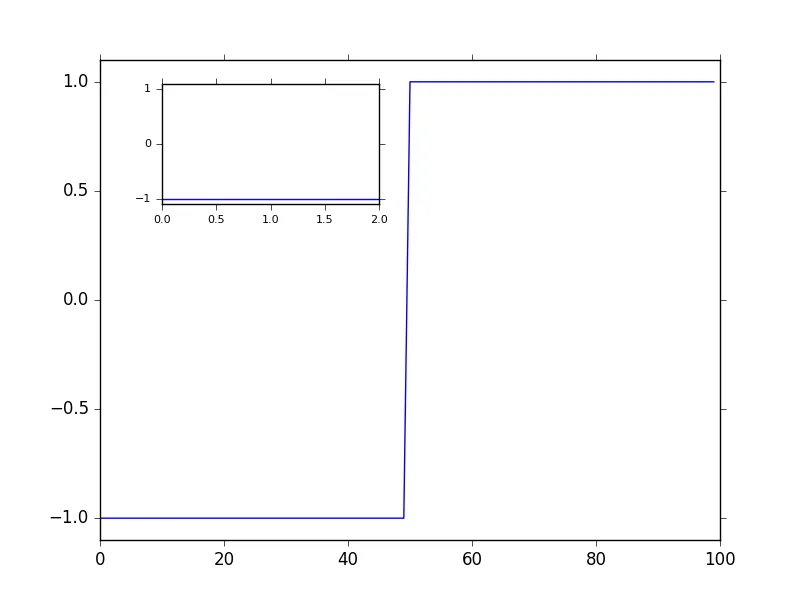
这个的输出结果是:
TRYING: (0.6, 0.7, 0.35, 0.25) RESULT: True
TRYING: (0.5, 0.7, 0.35, 0.25) RESULT: True
TRYING: (0.4, 0.7, 0.35, 0.25) RESULT: True
TRYING: (0.30000000000000004, 0.7, 0.35, 0.25) RESULT: True
TRYING: (0.2, 0.7, 0.35, 0.25) RESULT: True
TRYING: (0.10000000000000002, 0.7, 0.35, 0.25) RESULT: False
show()看起来运行良好。我猜测这是因为我们使用了 PDF 渲染器。顺便说一下,我认为inset_bbox = inset.bbox.inverse_transformed(axis.transAxes)这一行可能是多余的,因为inset_bbox从未被读取。 - snim2renderer = fig.canvas.get_renderer()而不是导入tight_layout或回答这个问题。无论如何,如果它已经起作用了,那太好了。很高兴能帮到你! - Ben Schmidt