我已经更新了我的R版本,包括所有的packages。函数arrangeGrob(Package gridExtra)已经发生了变化。
在我的旧版本的R version 3.1.3中,我使用如下方式来制作角落标签:
加载r packages
library(ggplot2)
library(grid)
library(gridExtra)
示例数据
a <- 1:20
b <- sample(a, 20)
c <- sample(b, 20)
d <- sample(c, 20)
创建数据框架。
mydata <- data.frame(a, b, c, d)
创建示例图表
myplot1  <- ggplot(mydata, aes(x=a, y=b)) + geom_point()
myplot2  <- ggplot(mydata, aes(x=b, y=c)) + geom_point()
myplot3  <- ggplot(mydata, aes(x=c, y=d)) + geom_point()
myplot4  <- ggplot(mydata, aes(x=d, y=a)) + geom_point()
设置角标签
 myplot1 <- arrangeGrob(myplot1, main = textGrob("A", x = unit(0, "npc")
     , y   = unit(1, "npc"), just=c("left","top"),
     gp=gpar(col="black", fontsize=18, fontfamily="Times Roman")))

 myplot2 <- arrangeGrob(myplot2, main = textGrob("B", x = unit(0, "npc")
     , y = unit(1, "npc"), just=c("left","top"),
     gp=gpar(col="black", fontsize=18, fontfamily="Times Roman")))

 myplot3 <- arrangeGrob(myplot3, main = textGrob("C", x = unit(0, "npc")
    , y  = unit(1, "npc"), just=c("left","top"),
    gp=gpar(col="black", fontsize=18, fontfamily="Times Roman")))

 myplot4 <- arrangeGrob(myplot4, main = textGrob("D", x = unit(0, "npc")
    , y = unit(1, "npc"), just=c("left","top"),
    gp=gpar(col="black",    fontsize=18, fontfamily="Times Roman")))

 grid.arrange(myplot1, myplot2, myplot3, myplot4)
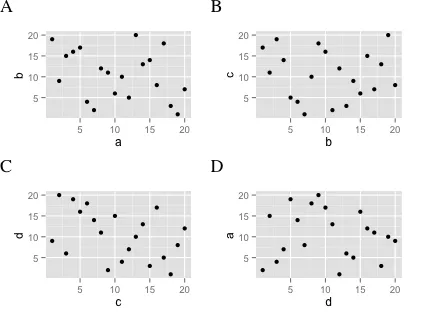
我得到了以下的图表,看起来很好:
但在新的R版本3.2.2下,图片看起来像这样:
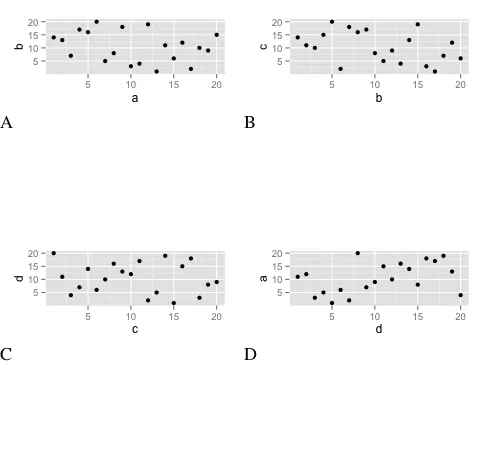
arrangeGrob为每个textGrob打开一个新的图像,我得到了八张图片而不是四张。如何修复它,使图表看起来像旧版本的R和gridExtra?
g <-arrangeGrob(myplot1, myplot2, myplot3, myplot4)时,我得到了一个以文本形式打印的 TableGrob,需要使用plot(g)来查看它。 - Dave Xgrid.draw(g)来代替。 - Dave X