Python 2D绘图如何转换为3D(Matplotlib)

3

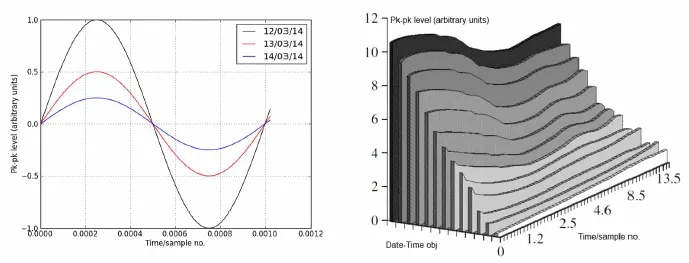
使用Matplotlib在Python中绘制图表:我每天在同一时间采集了许多样本,这些样本显示了某些测量值的变化。可以将其显示为2D图(如下左图),但随着样本数量的增加,我希望将这些数据显示为堆叠的3D图(如下右图)-此图仅用于说明。
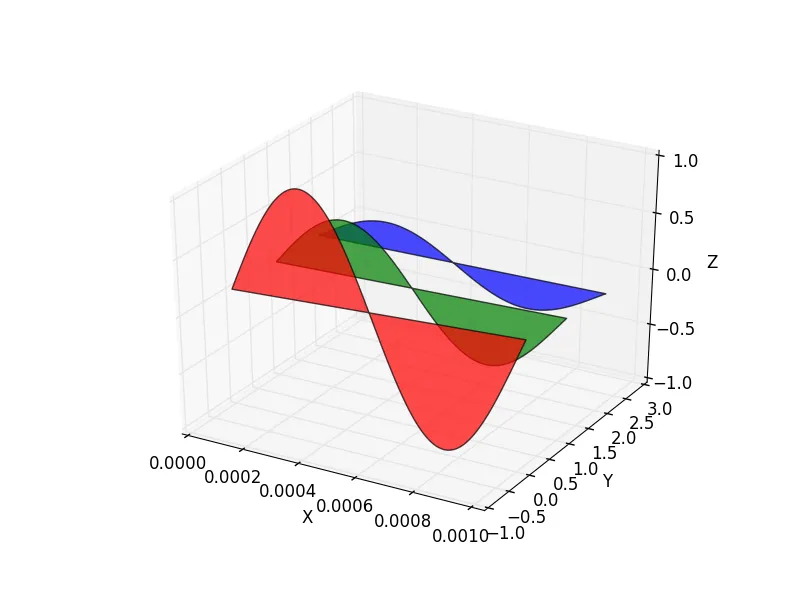
以下是我编写的初始代码,请问如何实现?

import numpy as np
import pylab as plt


t  = np.arange(1024)*1e-6
y1 = np.sin(t*2e3*np.pi) 
y2 = 0.5*y1
y3 = 0.25*y1

plt.plot(t,y1,'k-', label='12/03/14')
plt.plot(t,y2,'r-', label='13/03/14')
plt.plot(t,y3,'b-', label='14/03/14')
plt.xlabel('Time/sample no.')
plt.ylabel('Pk-pk level (arbitrary units)')
plt.legend()
plt.grid()
plt.show()

enter image description here


请查看Matplotlib软件包的3D功能:http://matplotlib.org/mpl_toolkits/mplot3d/tutorial.html - Sleepyhead
1个回答

5
这个是这样的吗?
from mpl_toolkits.mplot3d import Axes3D
from matplotlib.collections import PolyCollection
from matplotlib.colors import colorConverter
import matplotlib.pyplot as plt
import numpy as np

fig = plt.figure()
ax = fig.gca(projection='3d')

zs = [0.0, 1.0, 2.0]
t  = np.arange(1024)*1e-6
ones = np.ones(1024)
y1 = np.sin(t*2e3*np.pi) 
y2 = 0.5*y1
y3 = 0.25*y1

verts=[list(zip(t, y1)), list(zip(t, y2)), list(zip(t, y3))]


poly = PolyCollection(verts, facecolors = ['r','g','b'])
poly.set_alpha(0.7)
ax.add_collection3d(poly, zs=zs, zdir='y')
ax.set_xlabel('X')
ax.set_xlim3d(0, 1024e-6)
ax.set_ylabel('Y')
ax.set_ylim3d(-1, 3)
ax.set_zlabel('Z')
ax.set_zlim3d(-1, 1)

plt.show()

enter image description here


网页内容由stack overflow 提供, 点击上面的
可以查看英文原文,
原文链接