Plotly Python - 热图 - 更改悬停文本(x,y,z)

9

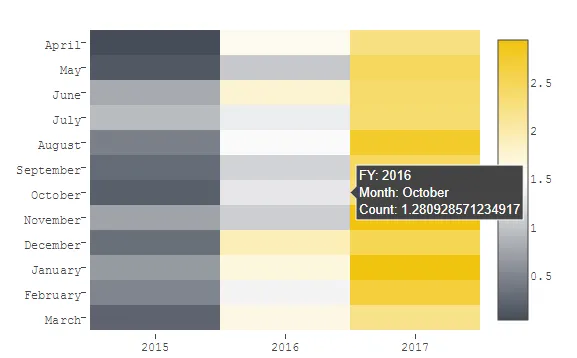
我用Python中的Plotly绘制了一个热图。虽然悬停文本效果完美无缺,但每个变量都带有x、y或z前缀,就像这样:

enter image description here

是否有办法改变这种情况?比如,将x="FY"、y="Month"、z="Count"。

以下是生成上面热图的代码

dfreverse = df_hml.values.tolist()
dfreverse.reverse()

colorscale = [[0, '#454D59'],[0.5, '#FFFFFF'], [1, '#F1C40F']]

trace = go.Heatmap(z=dfreverse,
                   colorscale = colorscale,
                   x = [threeYr,twoYr,oneYr,Yr],
                   y=['March', 'February', 'January', 'December', 'November', 'October', 'September', 'August', 'July', 'June', 'May', 'April'])
data=[trace]


layout = go.Layout(
    autosize=False,
    font=Font(
        family="Courier New",
    ),
    width=700,
    height=450,
    margin=go.Margin(
        l=150,
        r=160,
        b=50,
        t=100,
        pad=3
    ),
)

fig = go.Figure(data=data, layout=layout)
plotly.offline.iplot(fig,filename='pandas-heatmap')

谢谢你!

1个回答

21

您可以通过将其设置为text并输入任何内容来自定义hoverinfo。

hoverinfo的文本需要是一个列表的列表。第一个索引是y值,第二个是x值。

enter image description here

import plotly
import random
plotly.offline.init_notebook_mode()

colorscale = [[0, '#454D59'],[0.5, '#FFFFFF'], [1, '#F1C40F']]

x = [2015, 2016, 2017]
y = ['March', 'February', 'January', 'December', 'November', 'October', 'September', 'August', 'July', 'June', 'May', 'April']
z = [[i + random.random() for i in range(len(x))] for ii in range(len(y))]

hovertext = list()
for yi, yy in enumerate(y):
    hovertext.append(list())
    for xi, xx in enumerate(x):
        hovertext[-1].append('FY: {}<br />Month: {}<br />Count: {}'.format(xx, yy, z[yi][xi]))

data = [plotly.graph_objs.Heatmap(z=z,
                                  colorscale=colorscale,
                                  x=x,
                                  y=y,
                                  hoverinfo='text',
                                  text=hovertext)]

layout = plotly.graph_objs.Layout(autosize=False,
                                  font=dict(family="Courier New"),
                                  width=700,
                                  height=450,
                                  margin=plotly.graph_objs.Margin(l=150,
                                                                  r=160,
                                                                  b=50,
                                                                  t=100,
                                                                  pad=3)
                                 )

fig = plotly.graph_objs.Figure(data=data, layout=layout)
plotly.offline.iplot(fig,filename='pandas-heatmap')

2
非常感谢。很抱歉让您等了这么久,我在收到回复之前就下班了。我刚刚想起来登录并检查 :).... 它完美地工作了! - Nicholas
1
编辑:非常感谢您花费时间给出详细的回复! - Nicholas
除了x、y、z之外,是否可以添加其他文本标签?例如,假设我有每个国家的数据,并且热图显示特定国家的x、y、z。如何在悬停标签中包括“Country”,其中“Country”是滑块? - finstats
例如:https://dev59.com/530QtIcB2Jgan1zniNYc?noredirect=1#comment132188642_74903289 - finstats

网页内容由stack overflow 提供, 点击上面的
可以查看英文原文,
原文链接