如果您想要与子图相关的注释,则使用
ax.text进行绘制似乎对我来说是最方便的方法。
考虑类似以下代码的内容:
import numpy as np
import matplotlib.pyplot as plt
import string
fig, axs = plt.subplots(2,2,figsize=(8,8))
axs = axs.flat
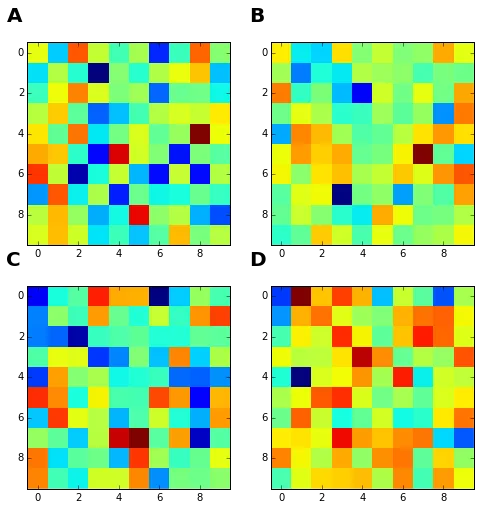
for n, ax in enumerate(axs):
ax.imshow(np.random.randn(10,10), interpolation='none')
ax.text(-0.1, 1.1, string.ascii_uppercase[n], transform=ax.transAxes,
size=20, weight='bold')
编辑:
使用新的plt.subplot_mosaic,可以将上面的示例编写为,可能更加优雅。考虑添加constrained_layout=True。
fig, axs = plt.subplot_mosaic("AB;CD", figsize=(10,10))

for n, (key, ax) in enumerate(axs.items()):

    ax.imshow(np.random.randn(10,10), interpolation='none')
    ax.text(-0.1, 1.1, key, transform=ax.transAxes,
            size=20, weight='bold')