GraphViz - 如何让子图从左到右排列,而主图从上到下排列?

33

我有一个类似这样的图形文件:

digraph {
    "Step1" -> "Step2" -> "Step3";

    subgraph step2detail {
        "Step2" -> "note1";
        "Step2" -> "note2";
        "Step2" -> "note3";
        "Step2" -> "note4";
        rankdir=TB
   }
}

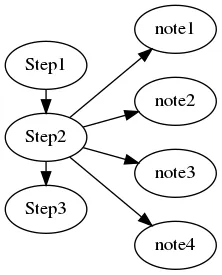
我希望子图“step2detail”能够悬挂在“Step2”的右侧。
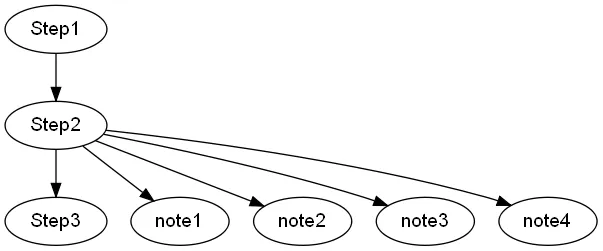
目前的效果如下所示:

enter image description here

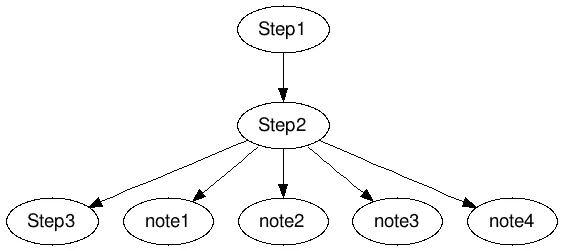
我希望Step1、Step2和Step3都竖直排列在同一列中。

5个回答

19

获得你所描述的图形的技巧是使用两个子图,并从一个子图链接到另一个子图。 "details" 中的不可见边缘是保持注释对齐的要点。

digraph {
    rankdir="LR";

    subgraph steps {
        rank="same";
        "Step1" -> "Step2" -> "Step3";
    }

    subgraph details {
        rank="same";
        edge[style="invisible",dir="none"];
        "note1" -> "note2" -> "note3" -> "note4";
    }

    "Step2" -> "note1";
    "Step2" -> "note2";
    "Step2" -> "note3";
    "Step2" -> "note4";
}
结果是:

在此输入图片描述


2
我不知道原问题提问者的意图是什么,但这个回答给出了我根据问题描述所想要的结果 - 而且我认为它会帮助我得到我自己的图表所需的东西。 :) - lindes
1
非常棒的技巧,但有点遗憾的是存在一些不必要的隐藏边缘。如果你只是用图形来生成图像,那么这不成问题,而这也可能是大多数情况下的情况,但如果有办法在不改变图形结构的情况下影响布局的话,那就更好了。 - Ben

8
这里有一个非常简单的方法 - 只需使用group属性,graphviz就会优先选择直线边缘:
digraph {
    node[group=a, fontname="Arial", fontsize=14];
    "Step1" -> "Step2" -> "Step3";

    node[group=""];
    "Step2" -> "note1";
    "Step2" -> "note2";
    "Step2" -> "note3";
    "Step2" -> "note4";
}

graphviz output


7
通过将步骤节点分组成一个集群子图,输出结果如下:
digraph {
    subgraph cluster_0 {
        color=invis;
        "Step1" -> "Step2" -> "Step3";
    }

    subgraph cluster_1 {
        color=invis;
        "Step2" -> "note4";
        "Step2" -> "note3";
        "Step2" -> "note2";
        "Step2" -> "note1";
   }
}

color=invis可以去掉集群周围原本会绘制的边框。


3

rankdir 在子图中不能直接使用,但是如果你添加另一组花括号 - 无论被称为什么 - rankdir 就可以工作了:

digraph {
    "Step1" -> "Step2" -> "Step3";

    subgraph step2detail {
        {
            "Step2" -> "note1";
            "Step2" -> "note2";
            "Step2" -> "note3";
            "Step2" -> "note4";
            rankdir=TB
            rank=same
        }
   }
}

enter image description here


也许有点晚了,但我使用了这个问题和页面底部的示例 https://graphs.grevian.org/example 来解决我正在处理的图表中的类似问题。因此,我认为您的解决方案可以在不使用子图和rankdir的情况下完成。对于格式问题表示抱歉。 digraph { Step1 -> Step2 -> Step3 Step2 -> note4, note3, note2, note1 {rank=same Step2, note1, note2, note3, note4} } - jj2f1
我不明白这段话的意思。note*节点并没有按照从上到下的顺序排列,因此这似乎并不是rankdir在子图中起作用的例子。实际上,如果我删除rankdir=TB,我会得到完全相同的结果;如果我也删除额外的一组大括号,我也会得到完全相同的结果。这只是展示了rank = same的一个例子吗?尽管这是唯一一个答案没有提到的语法,但它似乎是唯一真正起作用的部分。如果我错了(对graphviz非常新手,所以很可能),这需要更多的解释。 - Ben

-4
使用命令:rankdir=LR;
digraph {
rankdir=LR;

    "Step1" -> "Step2" -> "Step3";

    subgraph step2detail {
        "Step2" -> "note1";
        "Step2" -> "note2";
        "Step2" -> "note3";
        "Step2" -> "note4";
        rankdir=TB
   }

}

好的,但它看起来很奇怪;步骤1->步骤2->步骤3不在同一垂直位置。 - Jason S
7
修改子图的rankdir似乎没有改变任何内容 = \ - David Wolever

网页内容由stack overflow 提供, 点击上面的
可以查看英文原文,
原文链接